How Do Automated Solutions Increase Efficiency of Food Processing Companies?

 The busy lifestyles and rising trend of packaged and processed food, considering hygiene and the nutritional value, are resulting in the increasing demand for fruit and vegetable processing equipment in factories. There is a consistent increase in the demand for processed food items, such as mango and other fruit pulps, chutneys, pickles, canned fruits and vegetables, frozen peas, cauliflowers, and other vegetables, ready-to-eat and ready-to-serve products.

Therefore, in 2021, the fruit and vegetable processing equipment market stood at $5.6 billion; it is expected to have a 6.9% CAGR from 2021 to 2030, to generate $10.2 billion in revenue by 2030. It will be due to the burgeoning demand for automated processing equipment, as it facilitates increased efficiency, decreased manual labor requirement, and less time consumption. The burgeoning consumption of ready-to-eat food provides opportunities to the mushrooming start-ups and giants in the food processing industry to invest in automated processing machines and garner more profit.

At the heart of all, the growing population and its rising disposable income are resulting in the increasing investment in pre-processed food items, especially processed fruits and vegetables. The rise in the trend of veganism is also driving the demand for fruit and vegetable processing equipment, attributed to the advance of the plant-based food industry. According to dealsonhealth.net data, around 79 million people are vegan. The vegan market will hit $24.3 billion in revenue by 2026. Since veganism solely includes fruits, vegetables, and grains, this trend has been driving the demand for fruit and vegetable processing equipment.

The highest demand for such equipment is in APAC, as India and China are the largest producers of fruits in the world. According to CIPHET Ludhiana, around 18% of the fresh horticulture produce is wasted each year due to poor post-harvest management, while less than 2% of the perishable horticultural produce is processed into value-added products. These statistics hint at a huge scope of fruit and vegetable processing in India, especially considering the country’s initiatives to boost local manufacturing.

The U.S. is the third-largest country in terms of ready-to-eat and packaged food consumption, which signifies the booming demand for fruit and vegetable processing equipment in the country. It has a vast array of food processing companies to cater the requirements of people. The Food and Drug Administration regulations ensure the safety and nutritional value of processed food. It ultimately builds the trust of people in ready-to-eat, ready-to-cook, ready-to-serve, frozen fruits and vegetables, also aided by people’s high disposable income and strong focus on organic produce.  

Thus, the rising usage of pre-processing equipment is attributed to the need to decrease the time consumed in the cleaning process, without compromising the food products' hygiene and quality standards. Pre-processing equipment cleans off the pesticides and other substances used during farming to protect the crop. Moreover, packaging and handling equipment is widely utilized to increase the shelf life of the products, often in compliance with the stringent packaging and labeling standards around the world, including those implemented by the FDA and FSSAI.

Therefore, the rapid urbanization and busy lifestyles of people are driving the demand for fruit and vegetable processing equipment, attributed to the focus of food processing companies on catering to the need of the people for ready-to-eat and frozen food products.


Share:

Gallium Nitride Semiconductor Devices Market To Reach $72,813.1 Million by 2030

 The gallium nitride semiconductor devices market shall touch $72,813.1 million in 2030 from $12,084.6 million in 2021. Moreover, the market is predicted to grow at a 22.1% CAGR from 2021 to 2030 owing to the lower costs of GaN semiconductor devices in comparison to silicon variants, swifter device speed, and greater efficiency of energy. Furthermore, the global market is influenced by the rising count of robot shipments, which increased by 100,000 in 2022 from 500,000 in 2020.

The rapid integration of advanced technologies in electronics will drive the gallium nitride semiconductor devices market. It is projected that by 2025, mobile data traffic will reach 160 exabytes every month. The surging demand can be satisfied by supporting high data transfer rates and large bandwidths through extremely high-frequency bands. For instance, 5 mmWave ranges from 24 GHz to 300 GHz will offer smooth connectivity, enhanced performance, and increased coverage. Capitalizing on the new technology, an American telecommunication company launched a mmWave 5G network in 2020, accompanied by the introduction of the S20 Ultra and Galaxy S20 Plus.

The opto-semiconductors category led the product type segment of the gallium nitride semiconductor devices market in 2021, generating revenue of approximately $5.0 billion. This can be attributed to the wide usage of semiconductors in several sectors, majorly consumer electronics and aerospace & defense, for numerous devices. Additionally, the application of these devices in the automotive sector, for pulse-powered laser systems and automotive lights, is rising, which, in turn, will fuel growth in the market. A lucrative opportunity for market players in the opto-semiconductors market is the surging demand for ADAS.

Within the component segment, the power ICs category will rule the gallium nitride semiconductor devices market from 2021 to 2030. Because of the need for real-time air traffic control, efficient navigation, and collision avoidance, the requirement for GaN-based power ICs is increasing. These factors will offer opportunities to the key players by increasing the demand for these components. Moreover, the technological advancements in power ICs designed for telecom and automotive applications by top manufacturers will augment growth in the market.

North America dominated the gallium nitride semiconductor devices market in 2021, and it is expected to continue this trend in the future, by generating approximately $26 billion revenue in 2030. This can be credited to the greater adoption of smartphones and increasing internet penetration. As per predictions, more than 50% of this region will be covered by a 5G network by 2030, which would fuel growth in the economy. Furthermore, all of this will go hand in hand with the aggressive investments in media and content abilities, IoT applications, and 5G services.

Thus, the rising demand for power semiconductors in energy-efficient wired communications, with the consistent efforts of internet service providers for reduced latency, smooth connectivity, and enhanced capacity via optical cables, will drive this market.


Share:

How Does High Rise Structures Boost Structural Metal Products Market?

In 2021, the structural metal products market size stood at $448.3 billion, and it is expected to grow at a rate of 6.1% from 2021 to 2030, to acquire $764.0 billion in revenue, attributed to the rising construction activities led by infrastructure development worldwide. The surge in demand for structural metal products is attributed to their physical properties, including pest and mold resistivity, sustainability, and cost-effectiveness, propelling the market. The government-led infrastructure development projects such as railways and highway construction drive the market.

The infrastructure development activities to manage the transportation drive the structural metal products market. For instance, the massive usage of metal liners, casings, plates, culverts and bar joints in highway, railways and bridge construction leads to the expansion of the market. The government support to fund these infrastructure projects results in growing opportunities for businesses to generate more revenue. Highway construction activities are expected to rise in the near future, resulting in market proliferation.

Structural Metal Products Market

Under the product segment, the support and structure category generate a significant structural metal products market revenue amounting to more than 35%. There is an expected increase in the demand for these products, majorly for the construction of staircases, sheds, decks, and skyscrapers. Fabricated metal structural beams are more preferred in construction due to their long life, good grip and fire resistance properties. Numerous fabricated metallic supports and structures companies are established in Germany, attributed to the rise in construction for residential and construction buildings. 

The residential sector holds the largest structural metal products market share. It is expected to retain the same position in the coming future. The rising infrastructure development activities in Africa are attributed to the increased requirement for residential buildings resulting in market expansion. Moreover, the market is expected to witness a surge in non-residential sectors. For instance, the Belt and Road Initiative will increase China’s import and export of steel for infrastructure development activities within the region. The construction of roads, railways and ports will result in a market boom. 

North America dominates the structural metal products market, attributed to multi-story residential construction. The demand for structural steel is rising in the region, attributed to the construction of open-air stadiums, power plants, petroleum refineries and power plants. The non-structural applications of structural steel include the construction of transportation facilities, marine structures, rack systems and mobile homes. The APAC structural metal products market is expected to grow at a rapid rate in the near future. 

Therefore, the surge in infrastructure development activities attributed to the construction industry's expansion led to market penetration.

Share:

How Does Automotive Industry Boosts Polyurea Coatings Market?

In 2021, the polyurea coatings market valued at $995.2 million, and it is projected to reach $2,553.5 million by 2030, growing at a CAGR of 11.0% from 2021 to 2030. It is attributed to the growing awareness of environmental problems. Polyurea technology holds a significant share of the coatings industry, attributed to the high research and development investments. Under the end-user segment, the construction and transportation industries dominate the market. The surge in polyurea coatings demand in the defense sector propels the market. 

The aromatic isocyanates are the higher polyurea coatings market revenue generator under the raw material segment, amounting to 69.7% of the revenue. Aromatic isocyanates are comprised of amine hydroxyl groups that react to generate polyurea coatings. The aromatic isocyanates are used as basecoat. Aromatic isocyanates are highly utilized in the automotive industry, leading to market proliferation. The weather conditions of North America and Europe led to an increased usage of aromatic polyurea coatings. 

Polyurea Coatings Market

The automotive and transportation industry holds the largest polyurea coatings market share, ofthe  25.7%. The application of the polyurea coatings on the automobiles’ exteriors, such as trucks and two-wheelers, is driving the market, attributed to high resistivity from external physical and thermal pressure. Polyurea coatings are popular in Germany, Japan and China. The German automobile industry, which has household names such as Volkswagen, Mercedes, Opel, and BMW, contributes almost 20% of the industrial output of the country in terms of the value. 

The truck manufacturers highly utilize spray-on protective coatings due to the enhanced look and long-term protection, resulting in proliferation of polyurea coatings market. It is gaining popularity due to its properties, such as resistivity to corrosion, abrasion, and UV rays. The appealing look of the substrates and equipment safety offered by the polyurea coatings drive the market. Polyurea coatings are utilized on vehicle chassis as an alternative primer and as a topcoat on the vehicle’s body. The polyurea coatings market is expected to grow, attributed to the rising traction of heavy-duty vehicles on the road. 

Therefore, the expansion of the construction industry led by increase in infrastructure development activities is driving the market.

Share:

How Will Greater Adoption of Technologies Drive the Smart Home Appliances Market?

 In 2021, the smart home appliances market valued at $34.8 billion and is likely to reach $139.0 billion by 2030. The market is predicted to grow at a  16.6% CAGR from 2021 to 2030 owing to enhancing the lifestyle of consumers, greater adoption of technologies, and gradually increasing smartphones and internet penetration. With the emergence of COVID-19, the demand for these appliances increased as, after the outbreak, almost all the people worked from home and required smart applications to perform the monotonous tasks with ease. 

The smart home appliances market is driven by aggressive investments by people toward home improvement or redesigning projects to upgrade the conventional households and adapt to the changes in the current market dynamics. There is a paradigm shift in consumer preferences toward a smart home owing to their change of preferences, complicated and busy lifestyle, coupled with an increasing disposable income which will improve the purchasing power. The equity of the homeowner is significantly surging with an improvement in home value. This trend is in favor of the owners who are focused on home improvement. 

Wi-Fi technology will have a positive effect on the smart home appliances market growth being the easiest way to use smart devices. Wi-Fi-enabled appliances will approximately reach $68 billion by 2030 and account for total sales of around $16 billion in 2021. This can be ascribed to its features of working with a huge amount of data by default through proper infrastructure. The computer manages aa the applications through Wi-Fi. With an improvement in automation technologies and worldwide internet penetration, the market for smart appliances will boom.

Within the distribution segment, the smart home appliances market is bifurcated into online distribution channels and offline distribution channels. It is projected that the online sales of these appliances will advance at a higher growth rate. This can be credited to increasing consumer preferences in e-commerce and the rapid expansion of digitalization, especially among working professionals. Furthermore, the benefits offered by online distribution channels like e-retailers start-ups and e-commerce websites will drive the market such as the wide variety of products, enhancing accessibility of products through home delivery, annual sales benefits, and discount coupons. 

The residential sector plays a prominent role in the smart home appliances market growth because of snowballing demand for smart home appliances in this sector at a swift pace. The residential sector dominated the market in 2021, generating a revenue of approximately 70%. Being aware of the latest trends in the market, the consumers are increasingly inclined toward connected home solutions in an attempt to build a convenient living space and upgrade the standard of living.

The largest market for smart home appliances is APAC because of the rapid urbanization, growing population, and skyrocketing demand for luxury housing projects in the region accompanied by surging disposable income will pave the way toward smart homes. This, in turn, will have a positive effect on the technically advanced products in the region. This innovation is driven by the diversifying of the products offered and rising investments in R&D activities by prominent market players to attain a competitive edge.


Share:

How Does PEG400 Drive Polyethylene Glycol Market Growth?

In 2021, the polyethylene glycol market size stood at $4,534.8 million; it is expected to reach $6,909.6 million by 2030, growing at a rate of 4.8% from 2021 to 2030, attributed to the surge in demand for polyethylene glycol in the pharmaceutical industry to manufacture drugs and medical devices. Similarly, the increase in demand for PEG in inks, paints and water-based coatings drives the market growth. Moreover, the massive usage of polyethylene glycol as a specialty solvent or surface-active agents such as conditioners, shampoos, lotions, toothpaste and deodorants propel the market. 

PEG400 holds a significant share of polyethylene glycol market revenue, attributed to its low-molecular-weight grade with low toxicity. It is highly utilized in the manufacturing of drugs due to the hydrophilic nature of the PEG400, resulting in increased bioavailability and solubility of weaker water-soluble drugs. Ophthalmic solutions also use PEG400 as it acts as a relieving agent in irritation, discomfort or burning sensation in the eyes. Under the form segment, the opaque liquid category holds a significant market share. 

Polyethylene Glycol Market

APAC holds the largest share of the polyethylene glycol market, attributed to the massive usage of water-based coatings, inks and paints in the construction industry. Similarly, the surge in the paper industry in China and India results in market proliferation due to the rising demand for chemicals. The hydraulic fracturing technology is expected to create new opportunities for market players, attributed to the surge in unconventional resources production such as tight oil and shale gas.

The U.S. Energy Information Administration reported that presently the crude oil production in the region amounts to 11 million barrels daily. This is why North America holds a 30% polyethylene glycol market revenue share. Moreover, the expansion of the food and beverage and cosmetics and self-care industries drive the market. The rise in the cosmetics & personal care businesses is witnessed in the region, attributed to rising employment, busy lifestyles and growing demand for personal care products. 

Therefore, the construction and pharmaceutical industry expansion drives the market. 

Share:

Why Will APAC Dominate the Crop Protection Chemicals Market?

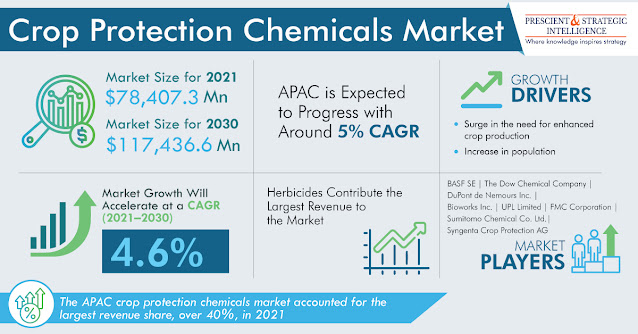
The major drivers in the global crop protection chemicals market are burgeoning population levels, the dire need to improve the scalability of crop production, scarce resources such as agricultural labor and land, and surging concerns over food security. In 2021, the market was valued at $78,407.3 million, and it is predicted to touch $117,436.6 million by 2030. Furthermore, the market will advance at a 4.6% CAGR from 2021 to 2030. In addition, there is a huge pressure exerted on the agricultural land and the farmers to improve the efficiency of agricultural lands. 

Crop Protection Chemicals Market

A skyrocketing investment in R&D will spur crop protection chemicals market growth. Enhanced integration of technologically advanced devices into the current farming activities will pave the way for generating higher revenue in the market by providing lucrative opportunities to the market players to gain a competitive edge. The farmers are in constant fear of crop failure because of the threat of pest attacks. Moreover, to minimize the risks associated with crop damage and to maximize crop production, pesticides are being extensively used in farming techniques.

Within the application segment, the cereals category will generate the highest crop protection chemicals market revenue, growing at a 5% CAGR from 2021 to 2030. The requirement to meet the skyrocketing need for food inventories by the population will enhance the efficiency of production, thereby helping the corporations to attain economies of scale. The surging awareness of leading a healthy lifestyle among the people is exerting a noticeable push on cereal production to cater to the dietary requirements of people. Therefore, this will propel growth in the market.

APAC led the global crop protection chemicals market in 2021, accounting for about 40% of the total market value. This can be credited to surging awareness of the use of pesticides, extensive farmland, and an inherent strong agricultural base. Moreover, the increasing adoption of technologically advanced products will propel growth in the market. In addition, it is also expected to exhibit the fastest CAGR because of the greater requirement for agrochemicals in emerging economies, such as China and India.

Hence, the skyrocketing population levels will drive the market by offering extravagant opportunities to the market players.

Share:

Why Will APAC Witness Highest CAGR in Air Purifier Market?

 The most-prominent factors propelling the air purifier market are the rising prevalence of airborne diseases, poor indoor air quality, and surging global air pollution levels, accompanied by better living standards. In 2021, the market stood at $11,422.7 million, and it is expected to reach $31,195.6 million by 2030. The market is projected to advance at a CAGR of 11.8% from 2021 to 2030 due to the rising awareness about curbing the spread of respiratory illness by driving down pollution levels.

The accelerating pace of the spread of airborne diseases, including the common cold, tuberculosis (TB), measles, and influenza, has been driving the air purifier market over the past few years. For instance, TB is the second-deadliest infection, followed by COVID-19 currently, and it ranks 13th among the leading roots of death all around the world. There were 10 million reported cases of TB and 7.5 million reported cases of measles worldwide in 2020. Air purifiers result in lower amounts of airborne pollutants in constricted spaces, as per the U.S. Environmental Protection Agency.

Within the technology segment, air purifiers with ionic and HEPA technologies constitute more than half the total market share. Of these, HEPA-technology-based devices are dominant owing to their advanced filters, which encompass multiple layers of meshes made out of fine threads of fiberglass. Bombarded with swift-paced air, these filters can dry out all the viruses. The minutest airborne components in the indoor air are captured by these filters, thus curbing allergies and other lung diseases. In addition, they can even capture the minute 0.125-micron COVID-19 virus.

A greater adoption of advanced ventilation technologies will encourage the air purifier market players to adapt to the shifting market dynamics. Without using any filter, negatively and positively charged ions are leveraged by ionizers to not only remove the tiny allergens but also improve the air quality, by purifying the air. The cost of ionizing-technology-enabled purifiers ranges from a minimum of $30 to a maximum of $300, depending on the model, size, and brand. Apart from reducing the air pollution levels, this technology also causes less noise pollution at the lowest possible operational costs.

Under the application segment, by holding an around 20% share, the residential category occupied a significant position in the air purifier market in 2021. Additionally, it is projected to advance at the highest compound annual growth rate owing to the rising adoption of smart homes and green buildings, accompanied by a surging awareness of diseases resulting from deteriorated air among people. Owing to their enhanced performance, lower weight, lower costs, and higher reliability, HEPA-technology-enabled air purifiers are extensively used in houses.

In 2021, approximately 40% of the total revenue in the air purifier market was generated by APAC. This can be attributed to the extensive industrialization, swift urbanization (and subsequently rising disposable income), and growing population. All of this goes hand in hand with the deteriorating air quality levels, especially in Pakistan, Bangladesh, and India, where the pollution levels exceed by a minimum of ten times, as mentioned in the IQAir report of air quality.


Share:

Why Will APAC Rule the Pressure Washer Market?

The major drivers in the global pressure washer market are the increasing count of carwash stations, coupled with a snowballing demand for pressure washers in commercial as well as residential areas. In 2021, the market stood at $2,629.1 million, and it is predicted to touch $3,868.9 million by 2030. In addition, the market will grow at a 4.4% CAGR from 2021 to 2030. A swift urbanization rate will increase the requirement for residential projects, in turn, surging the requirement for home cleaning systems, such as pressure washers. This will augment growth in the market.

Pressure Washer Market

The outbreak of COVID-19 had disrupted several sectors but the pressure washer market is among the exceptions. The spread of the virus had exerted a push on the importance of sanitization and cleaning among several corporations. There would be dramatic changes within the cleaning industry amid the pandemic. There is a skyrocketing requirement for pressure washers in the cleaning applications in an attempt to meet the standards of sustainability and hygiene. Thus, the commercial cleaning industry had very well bridged the spaces between the forces of demand and supply by enhancing their efficiency.

APAC will witness the fastest pressure washer market growth, of approximately 5%, on account of extensive government support. For example, an investment of $1.4 trillion was made by the government of China with the aim of inter-city transportation systems, 5G networks, and digital infrastructure development. Moreover, an increasing disposable income will exert a push on the requirement for swimming pools, gardening, floor cleaning, and vehicle washing maintenance services. Approximately, 80 million sales were accounted for in the automobile sector in 2021 according to the OCIA, thereby, creating the carwash services demand.

The hot water category will witness a 4% CAGR in the pressure washer market from 2021 to 2030. It offers an efficient cleaning process and minimizes the cleaning time by 35%. There is a robust demand for deep cleaning applications, including grease and clean oil. Daimer's Super Max hot-water pressure washers, in particular, have temperatures of up to 572 °C (300 °F), pressures of up to 3,500 psi, and flow rates of up to 10 gallons per minute.

Share:

APAC is Dominating Force in Rare Earth Metals Market

The size of the worldwide rare earth metals market was approximately $7,063.8 million in the year 2021 and it will reach a value of $15,473.0 million by 2030, advancing at a compound annual growth rate of approximately 9% during the forecast period. This will chiefly be a result of the growing use of these elements in the customer electronics, space, and automotive industries. With rapid industrialization, there is been an intensification in the growth of all the industries employing rare metals as raw materials.

The APAC rare earth metals market will have the highest growth rate, in excess of 9%, in the near future. China has the largest reserves of the majority of rare earth elements and is the largest producer, with a share in excess of 60% of the global output. Furthermore, it is the key exporter of these elements. With the increase in the production of vehicles and the development of the construction industry, the industry is growing continuously. These minerals are employed as alloys for the manufacture of automobiles and their parts.

Rare Earth Metals Market

The growth of the rare earth metals market is mainly because of the increasing use of neodymium magnets in the machines of MRI, to get internal assessments of the human body without the use of radiation. This is because of the heavy funding in the healthcare industry by the government and top companies at a global level. According to statistics, in 2021, the global healthcare investment was valued at around $6 billion. Furthermore, numerous uses of these metals are in protection equipment like communication equipment, precision-guided weapons night-vision goggles, and stealth technology, which are pushing the demand for the same.

There is an increase in the demand for rare metals at a global level due to the use of the same in a large number of industries such as customer goods.

Share:

Increasing Focus on EVs in India Propelling Demand for Discrete Power Semiconductor Devices

 EVs promise zero emissions from the exhaust and a decrease in city air pollution. With an aim of attaining 30% EV penetration by 2030, the Indian government has initiated the FAME India program, which encourages the adoption of EVs. The initiative propels the requirement for discrete power semiconductors as they are used for power conversion purposes in these automobiles.

Apart from the increasing use of EVs in the country, the growing need for power electronic modules in various industries is the major factor for the Indian discrete power semiconductor devices market advance. From $1,007.7 million in 2021, revenue generated from the sale of these components is likely to propel at a 12.2% CAGR during 2021–2030, ultimately reaching $2,834.2 million.

Due to the rising pollution levels and increasing fuel prices, several policies have been adopted by the government to push the use of EVs. For example, a policy was introduced by the Delhi government in 2020 to fuel the evolution of battery EVs, in order to achieve a 25% EV share in the registrations of new vehicles by 2024. Initially, 100 EV charging points and battery stations, each of which can charge five automobiles, will be set up at as many locations, the majority on land under the ownership of DMRC.

The largest share in the Indian discrete power semiconductor devices market was held by the TO-247 category within the package type segment in 2021, a situation that is predicted to remain unchanged over the forecast period. This is credited to the decent thermal conduction straight to a heat sink, negligible stress in installing activities, and a bigger die or lower on-resistance and high-current devices provided by this type of packaging.

The rising acceptance of consumer and connected devices is also likely to intensify the growth of the industry. Power electronic products are widely used in home appliances, such as AC power supplies, dishwashers, induction heaters, and washing machines. Most power electronics are enhancing load controls, for example, variable-speed-drive motors for fans, compressors, pumps, or switching power supplies that are there in most consumer electronics.


Share:

LED Technology Contributes 71.9% Revenue to Automotive Ambient Lighting Market

 In 2021, the automotive ambient lighting market stood at $3,203.8 million; it is set to grow at a rate of 9.2% from 2021 to 2030, to acquire $7,087.5 million revenue by 2030. Ambient automotive lightning is attractive and robust and possesses exterior and interior illumination. The rise in the disposable income of inhabitants leading to the adoption of a luxurious lifestyle to add comfort is driving the demand for automotive ambient lights. Moreover, the growing economies and original equipment manufacturing unit establishments lead to market expansion. 

The automotive sector is witnessing rapid growth in India, China, South Korea and Japan, leading to the expansion of the automotive ambient lighting industry. The increase in demand for economy vehicles in APAC is attributed to the significant users of car body lights, roof console lights and reading lights. This is why APAC registers over $1,400 million in sales of ambient lighting products to OEMs, garages, service centers, and DIY consumers. The government initiatives to promote the adoption of connected and autonomous cars is also resulting in the market boom. 

Automotive Ambient Lighting Market Value 2022-2030


The halogen technology is expected to witness an increase in demand in the near future, ascribed to the low-cost availability of the technology, leading to automotive ambient lighting market expansion. The halogen technology appeals to the vehicle’s interior, enhancing its outlook. Halogen lamps are easy to install and utilize, attributed to their standard design and “plug and play” function, resulting in a boost in the market. 

The rise in the luxury lifestyle to increase comfort is resulting in dominance of dashboard lights in the automotive ambient lighting market. The increased traction of the passenger cars and autonomous vehicles on the road in North America results in a surge in demand for advanced lights in dashboards, leading to market expansion. Under the type segment, the heads-up display category is expected to witness substantial growth in the market. It is attributed to the growing requirement for the driver's uninterrupted vehicle information display.  

Therefore, the rising trend of utilizing halogen technology to make the vehicle look attractive and create an aesthetic appeal, including the luxurious lifestyle to add more convenience and enhance the driving experience, boosts the market. 

Share:

How Does Automation Leads to Surge in Commercial Lawn Mower Market?

In 2021, the commercial lawn mower market valued $14,741.3 million, and by 2030, it is set to reach $26,346.6 million, advancing at a rate of 6.7% from 2021 to 2030. Technological advancements and infrastructure development projects such as smart cities are leading to market growth. The rapid urbanization leading to increased construction of commercial buildings is likely to boost the demand for gardening and lawn maintenance equipment.

The commercial lawn mower market is expected to boom due to the advanced systems integrated into the lawn mowers, such as sensors that perform weather sensing, obstacle identification, anti-theft and other tasks to provide convenience to the consumers. Moreover, lawn mowers powered by AI can potentially transform the market. It will enable users to connect the lawn mower with their smartphones and remotely access it through Bluetooth, cellular connectivity or Wi-Fi. 

Commercial Lawn Mower Market

The worldwide smart cities projects are gaining momentum, leading to a surge in demand for smart devices for ease of convenience penetrating the commercial lawn mower market. Artificial intelligence, machine learning and the internet of things led technologies expand smart cities equipped with smart infrastructure, leading to increased demand for robotic lawn mowers. The rapid urbanization leading to the construction of new structures, including maintenance of green areas for soccer fields, golf course fairways, airports and other sports fields, leads to a surge in demand for lawn mowers.

Golf courses & other sports arenas contribute highly to the commercial lawn mower market revenue generation, accounting for $3,307.1 million. It is expected to follow the same trend in the coming years, attributed to the rising popularity of golf among people. Numerous youngsters are participating in golf sports worldwide, leading to increased investments in the construction of golf courses. It will further lead to increased demand for commercial lawn mowers. 

North America contributed significantly to the commercial lawn mower market revenue generation amounting to $5,540.4 million; it is expected to retain the same position in the near future. Increased demand for lawn mowers is attributed to the prominence of golf courses in the region. Numerous initiatives of governments to promote the development of green areas for public usage have also resulted in the increased demand for lawn mowers. 

Thus, smart cities with smart infrastructure projects that includes the development of green areas for various sports and other public activities is expanding the market.

Share:

Why Will APAC Dominate Epoxy Adhesive Market?

By 2030, the worldwide epoxy adhesive market is predicted to touch $13,483.9 million from $8,217.9 million in 2021. The market will advance at a 5.7% CAGR from 2021 to 2030 owing to the rising need for adhesives from the marine, cement, plastic, construction, and automotive sectors. To meet the environmental standards, corporations are developing green sealants and adhesives over chemical adhesives. They are engaging in advancing the technologies for the production of these green products. For instance, the RENUVA technology for sealants and adhesives has been developed by The Dow Chemical Company to enhance water resistance.

Based on end user, the building and construction sector ruled the epoxy adhesive market with revenue of approximately $2.3 billion in 2021. This can be attributed to the adaptability of the adhesives in the construction and building sector. Their dominance can be justified by their varied application in surface repair, gap filling, and lamination. Their application can be extended to stainless steel, bricks, ceramics & porcelain, cellular PVC, and fiberglass. Hence, with the growth in the construction of residential, industrial, and commercial spaces, the consumption of these bonding agents is booming.

Epoxy Adhesive Market

Based on type, the epoxy adhesive market can be bifurcated into one component and two-component. The one-component category holds the larger share because of the enhanced features of these variants, including solvent-free mixture and fast curing. Since no mixing is required in this variant, it is more appropriate for assembly lines as it uncomplicates the manufacturing process and makes it effortless. However, there will be an increasing requirement for two component-based epoxy adhesives in the forecast period, especially in construction activities.

APAC dominates the epoxy adhesive market, attributed to its massive electrical, electronics, & semiconductor; automotive, and construction industries. China is the highest revenue generator in this region because it is among the biggest exporters of sealants and adhesives, home to all important market players’ manufacturing units because of economical labor, and the largest country in terms of purchasing power parity. In addition, India will also witness growth due to the rising count of consumers, cheap labor, and expanding automotive industry.

Hence, epoxy adhesive demand is burgeoning across the globe due to the growth of the automotive and construction industries.

Share:

How Macroeconomic Development Drives India Prime Power Diesel Generators Market Growth?

The Indian prime power diesel generators market is being driven by the increasing infrastructure expenditures and a substantial power deficit. Because of these factors, the market is projected to reach $356.3 million in 2030 from $143.6 million in 2021, at a CAGR of 10.6% from 2021 to 2030. The commercial sector has a strong need for medium- and high-power diesel gensets. Similarly, the substantial expansion in the manufacturing and construction industries is likely to fuel market growth.

Furthermore, India's burgeoning telecommunications industry is a major driver for the Indian prime power diesel generators market. This industry is concentrating on overcoming one of the most-significant challenges of unpredictable power supplies from the grid. As a result, prime power diesel generators are commonly used by telecom tower operators. The number of telephone users in India rose by 0.71% from January 2021 to the end of February 2021, as per the Telecom Regulatory Authority of India (TRAI). This increases the strain on telecommunications businesses to maintain the operationality of the towers despite the inconsistent grid supplies.

By 2030, the commercial application category is set to account for over 70% of the Indian prime power diesel generators market revenue. This will be due to the high need for a constant electrical supply in commercial facilities, such as hotels, train stations, phone exchanges, and retail stores. Prime power diesel generators serve as a backup power source and a type of insurance, allowing businesses to avoid losing money due to a lack of adequate power for operations. As a result, in 2021, firms selling these devices in the country made over 60% of their income from commercial sales.

Uttar Pradesh has the highest demand for diesel gensets for prime power applications, and it is projected to continue to do so in the future. In 2021, the state had an Indian prime power diesel generators market share of over 10% and produced over $20 million revenue from genset sales. This was owing to the increasing expenditures in the telecom industry, rising power demand in the state's residential facilities, and rapid commercial infrastructure expansion. In addition, the rebound in the Indian commercial and residential real estate industries, commissioning of new construction projects, and a comeback in industrial investment would provide attractive prospects for participants in the future years.

Hence, the growth of the commercial sector is expected to drive the demand for gensets to offer prime power in India.

Share:

Why Does APAC Hold Largest Share in Lithium-Ion Battery Market?

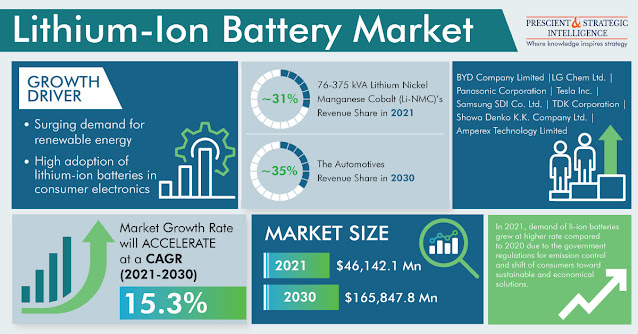
Due to the increasing demand for renewable energy and the high adoption of lithium-ion batteries in consumer electronics, the global lithium-ion battery market was worth $46,142.1 million in 2021. By 2030, with a high CAGR of 15.3%, the market size is expected to reach $165,847.8 million. The key factors responsible for the rising usage of these energy storage devices include a growing focus on environment-friendly practices, rising energy demand, and low operating and maintenance cost of lithium-ion batteries.

In 2021, Li-NMC versions accounted for 31.4% of the total lithium-ion battery market revenue. Because of their long life, large storage capacity, and excellent temperature stability, Li-NMC batteries are mainly utilized in electric vehicles and consumer devices. Moreover, battery researchers and designers are concentrating their efforts on reducing the cobalt percentage in the NMC cathode, which will decrease the cost of the battery and propel the market in the coming years. Furthermore, because these energy storage systems have high specific energy, most automotive businesses use them in EVs.

Lithium-Ion Battery Market

According to the United Nations, transportation networks have a substantial environmental impact, accounting for around 25% of the worldwide greenhouse gas emissions. As a result, governments are encouraging the usage of EVs to achieve a sustainable and environment-friendly lifestyle. Furthermore, as a result of the increasing oil costs, the demand for EVs has risen considerably in recent years, thus favoring the lithium-ion battery market. For example, the price of diesel has risen from $2.56 per gallon to $3.54 per gallon from 2020 to 2022, as per the U.S. Energy Information Administration.

The existing production capacity needs to be significantly increased, which presents an opportunity for businesses looking to invest in the lithium-ion battery market in certain locations. The acceptance of these solutions across a wide range of applications would be catalyzed by the lowering component prices, mass production, and the adoption of innovative technologies to enhance battery capacity and decrease the price. The cost of lithium-ion batteries has dropped by 85% in the last decade, thus making EVs and energy storage devices financially viable.

Li-ion battery recycling trends, favorable government legislations, advancements in environment-friendly technology, and expanding investor stake in the business are all contributing to an increase in the worldwide production of sustainable alternatives. Because of their high specific power/energy density, lithium-ion batteries have overcome the intermittency difficulties connected with renewable energy. They may be used to store the excess energy produced by wind and solar facilities during low-demand periods and then sell it to the market when the demand spikes.

In 2021, the APAC lithium-ion battery market earned $24,586.2 million in sales and held the largest share. Consumer electronics sales are rising in the region, which is boosting industry development. The use of these batteries is also aided by the fast technological advancements and increasing demand for smart gadgets. Moreover, electric car prices are decreasing in the region, thereby increasing the use of lithium-ion batteries in South Korea, India, Japan, and China.

Hence, the low maintenance and operating cost of lithium-ion batteries are propelling the market growth.

Share:

Why Water-Based Adhesives will Help in the Growth of Construction Adhesives Market?

In 2021, the worldwide construction adhesives market was valued at $9,101.5 million and it is projected to touch $14,541.9 million by 2030. The market will advance at a CAGR of 5.3% from 2021 to 2030 due to surging demand for low volatile organic compound content adhesives, such as water-based adhesives and pressure-sensitive adhesives, along with the expanding construction sector. The growing population all around the world, coupled with the rising disposable income will help this market to grow because people will be able to purchase more residential and commercial spaces. 

Under the segmentation of type, the acrylic construction adhesives ruled the construction adhesives market in 2021 with the revenue, accounting for $3,862.3 million revenue. This is predicted to advance at a CAGR of 5.7% from 2021 to 2030 owing to the robust growth of the construction sector in the MEA and APAC regions. There is a strong preference for this category due to its high water-resistant capacity and strong bonding with substrates. Furthermore, polyurethane adhesives are projected to generate the second-highest revenue in the coming years due to their binding capacity with almost every substrate from wood to plastic.

Construction Adhesives Market Size

 In 2021, the APAC construction adhesives market generated approximately 45% of the total revenue the construction adhesives market. This can be ascribed to significant economic growth, swift urbanization, growing population, rising disposable income, and consequently, surging consumer purchasing parity will drive the market. Moreover, increasing government investment in infrastructure and rising demand for low volatile organic compound content adhesives propels the market growth. Approximately, $13 trillion will be invested by China in the construction sector by 2030. 

Nevertheless, North America is predicted to generate the second-highest revenue share in the construction adhesives market, advancing at a CAGR of about 5.1% in the forecast period. This can be credited to technologically-advanced adhesives availability and their integration in cladding applications, insulation, roofing, and waterproofing. Additionally, the surging requirement for adhesives offers cracks prevention on airport runways and highways and safeguard buildings from uncertainties of weather. All of this together will drive market growth in this continent.

Hence, boost in the construction sector, swift urbanization, growing population, and rising disposable income will spur market growth.

Share:

How Is Refractories Market Expanding due to Infrastructure Development?

The estimated revenue of the global refractories market was $27.8 billion in 2021. The expected CAGR for the industry from 2021 to 2030 is 4.7%, with which the market size will reach $42.2 billion in 2030. Refractories are natural and synthetic materials, including non-metallic materials or combinations of compounds and minerals, such as bauxite, chromite, fireclays, zirconia, and silicon carbide. They are used to line the surfaces of furnaces, which are widely used in the metallurgy sector for casting, sintering, and smelting.

The primary driver for the global refractories market is infrastructure development, increasing usage of non-ferrous materials, and growing glass industry. Refractories are primarily used for furnace linings and other applications due to their thermomechanical properties and resistance to high temperatures. They can tolerate temperatures ranging from 500 °F to 3,326 °F, which is higher than most other elements’ melting points. The melting temperature of pure refractory materials usually ranges from 3,300 °F to 6,000 °F.

Refractories Market
To learn more about this report: https://bit.ly/3OxRB3x

The largest refractories market share was held by bricks and shapes, of 60%, under the form segment, owing to the high demand for this form in the metal and non-metal industries. The insulation layer within the ovens and kilns is built of refractory bricks. It has to be replaced regularly depending on the insulation requirements of customers, which is why bricks hold the most-significant proportion of the market. Refractory bricks are made of ceramic material and possess various properties, such as strong insulation and heat resistance.

The largest refractories market is APAC, accounting for $17 billion in 2021. The World Steel Association reports that APAC accounts for 70% of the worldwide steel output, with China alone responsible for around 50% of the production. It produced over 1,000 million tons of crude steel and more than 1,300 million tons of steel products in 2020. Moreover, the steel industry in India is driven by the domestic availability of raw materials (iron ore) and cost-effective labor. One of the most-significant factors behind the dominance of APAC on the global market is the growing non-ferrous metal industries.

Therefore, the need for heat resistance is the major driving factor for the surge in the demand for refractory materials across industries.

Share:

Why Will Residential Category Dominate the Fiber Cement Market From 2021 to 2030?

By 2030, the global fiber cement market is predicted to reach $27,743.8 million, since being valued at $17,500.0 million in 2021. The market is projected to advance at a 5.3% CAGR from 2021 to 2030. This can be ascribed to the surging requirement for fiber cement for external and internal residential applications. Moreover, the substantial rise in the residential sector will propel market growth. Furthermore, the magnificent properties of fiber cement, including stability, durability, better strength, fire-aversion, and water-aversion characteristics are skyrocketing the market demand.

A gradual shift toward green building will spur the fiber cement market growth. Contrary to asbestos, fiber cement is an environmentally sustainable substitute. Owing to its environmental benefits, national governments have constrained asbestos use and imposed a ban on it, promoting the usage of fiber cement. For instance, the European Union had banned the use of asbestos in new products for its hazardous impact on health.

Fiber Cement Market

Extensive government support for green construction and buildings will pave the way for fiber cement market growth. For instance, there is an evolution of environment-friendly and green community facilities by the Government of Canada all around the country via new constructions, repairs, retrofits, and upgrades. Similarly, Mexico is also following the green building trend by taking the right lessons from the U.S., Canada, and European countries. This would not only assist in reaping the health benefits of environmentally sustainable buildings but also save money.

APAC is expected to continue this trend in the coming years growing at a 6% CAGR. The region is home to various emerging economies in the world which have a vision of creating lucrative opportunities to boost the infrastructure. Furthermore, the growing population, rising disposable income, surging purchasing power parity among the consumers, greater FDI, and rising awareness about hazardous asbestos use will augment growth in the region. For example, the Chinese government-sanctioned 26 infrastructure projects worth $142 billion in 2019 that are expected to be finished by 2023.

Hence, substantial growth in the residential sector and surging requirements for fiber cement for external and internal residential applications will drive the market.

Share:

Where Will Growing Mining Sector Take U.S. Engine-Driven Welder Market?

The growing requirement for engine-driven welders to suffice the dual purpose of producing power and welding in the mining industry and rising construction activities are driving the U.S. engine-driven welder market. Hence, equipment sales generated $122.3 million in 2021, and this number will likely grow to $185.8 million in 2030, with a 4.8% CAGR from 2021 to 2030. There has been a significant rise in the usage of improved engine-driven welders owing to manufacturing companies' development of small, light, and efficient products.

Due to the pacing up of mining activities across the country, the demand for such systems is likely to expand rapidly. The value of the raw mineral produced by the country in 2020 stood at $90,000 million, growing by another $10,000 million, or 10%, in one year. Moreover, a surge in the need to repair mining equipment propels the U.S. engine-driven welder market advance. Mining companies prefer such welders owing to their dual operational capability for prime and backup power supply, in addition to their primary purpose of welding.

U.S. Engine-Driven Welder Market

The construction sector also utilizes engine-driven welders for various purposes, concerning their dual usage. Therefore, as construction activities are likely to increase in remote areas without any surety of power availability, the U.S. engine-driven welder market will only grow. Due to their application for supplying power when there is no ensured availability of electricity and serving as a welding machine simultaneously, they have become widely common in construction sites.

The sales of engine-driven welders with a power output of 300 to 399 Amperes continues to rise in the country. The primary factor behind such  U.S. engine-driven welder market growth in this category is their rising usage in the construction, pipeline, structural steelwork, and maintenance and fabrication applications. Farmers also widely use 300–399A engine-driven welders for equipment repair and fabrication applications. This is why this power rating category will likely witness the fastest growth, at a 5% CAGR, in the coming years.

Thus, the construction sector has benefitted the market due to the numerous infrastructure projects backed by the government of the country.

Share:

Australia Ventilation Products Market Is Set To Reach $1,003.9 Million by 2030

 In 2021, the Australia ventilation products market accounted for $569.4 million in revenue, and it is predicted to reach $1,003.9 million by 2030, advancing at a 6.5% CAGR between 2021 to 2030. The increasing number of residential and commercial projects, rising awareness of the health and environmental implications of polluted air, and growing demand for decentralized ventilation are contributing to the market expansion.

Essentially, the key aspect driving the market growth is the increasing population. For example, the total construction output in Australia increased by roughly 0.5% in June 2021 as compared to June 2020. The residential sector was worth roughly $14 billion, while the non-residential industry was worth around $8 billion. 

Key Findings of Australia Ventilation Products Market Report

• In 2021, the ventilation fans category led the Australia ventilation products market, and this is likely to continue over the forecast period. This is because these fans are often installed in commercial spaces.

• In 2021, the commercial category accounted for over 70% share of the Australia ventilation products market. Economic growth and rapid urbanization have contributed to the increase in the number of hotels, offices, malls, and hospitals, thus surging the demand for ventilation solutions.

As compared to centralized ventilation, decentralized ventilation offers numerous benefits. Decentralized ventilation enables the system to meet the demand of each zone in terms of indoor air quality. 

Furthermore, decentralized systems can improve ventilation efficiency by removing pollutants closer to the source, reducing the volume of supply air needed, and the energy required to condition and distribute it. These systems are advantageous because each component of a building's ventilation system may be operated individually.

Fantech Pty. Ltd. launched a new range of Trade sweep fans in January 2020. They are compatible with Fantech Trade's newest invention, the "AeroGlide System." There are four variants available: black and white, LED and non-LED, and an IP55-rated type for outdoor use.

Vent-Axia Group Limited and Ventair Pty. Ltd. announced their collaboration in August 2019. Ventair became a new supplier of the Vent-Axia in Australia as a result of the cooperation.

Due to the increasing carbon emissions, rising pollution levels, and advancing awareness toward maintaining a sustainable and healthy environment, the demand for green/smart buildings is growing. Water conservation, energy efficiency, waste reuse and recycling, greenhouse gas emission reduction, and natural resource use minimization are all examples of green building practices.

The Australia ventilation products market is highly fragmented. To gain a competitive edge, players have entered into partnerships and launched new products in recent years. These players are Vent-Axia Group Limited, Fantech Pty. Ltd., Johnson Controls International Plc, Carrier Global Corporation, Panasonic Corporation, Ventair Pty. Ltd., LG Electronics Inc., Samsung Electronics Co. Ltd., Daikin Industries Ltd., and Mitsubishi Electric Corporation.


Share:

Madagascar Diesel Generators Market To Reach $27,755.7 Thousand in 2030

The Madagascar diesel generators market was valued at $21,429.8 thousand in 2021, and the market will propel at a 2.9% CAGR during 2021–2030, to reach $27,755.7 thousand. The speedy growth in the construction and telecom sectors and the intensification in the incidence of power cuts are the main factors accountable for the growth of the market. 

According to the World Bank, only about 27% of the population of Madagascar had access to electricity in 2019, which is one of the primary reasons for the increasing requirement for diesel gensets in the mining, telecom, construction, and residential sectors.


The telecom sector of Madagascar has profited from the snowballing rivalry among key operators such as Orange Madagascar, Airtel, and Telma. In 2021, the government relaxed the excise duty on telecom products to 8% from 10%, which is advantageous for customers. This opened the gates for a high requirement for diesel generators set in telecom towers to cope with the high-frequency power cuts.

Key Findings of Madagascar Diesel Genset Market

The 15–75 kVA category held the largest share, of approximately 42%, in 2021. This is due to the increasing use of these gensets in residences, small industries, restaurants, hotels, telecom towers, and commercial complexes. 

Furthermore, the 376–750 kVA category is the second significant contributor to the Madagascar diesel genset market.  The primary reason for this is the high requirement for these generators in industries and commercial complexes.

The commercial application category is likely to grow at the highest rate in the years to come, propelling at a 3.9% CAGR. This can be primarily due to the constant advancement in the construction sector.

The Madagascar diesel genset market is likely to be boosted by the increase in the requirement for power backup in the commercial and residential sectors and the development of the mining and construction industries.

Power consistency is an important prerequisite for Madagascar’s economic development. Thus, the requirement for energy among public institutions of the country has augmented, to improve the eminence of the services provided to people.

Key firms in the Madagascar diesel genset market are taking part in partnerships and alliances with the intention of staying ahead of their competitors. For example, Green Energy Solutions (GES) and Colas Madagascar entered into a collaboration in April 2021 to construct a hybrid power plant driven by solar energy for Colas Madagascar at the Ambokatra quarry and offer construction supplies within the country.
Share:

How Does Automotive Industry Drive LTCC and HTCC Market Growth?

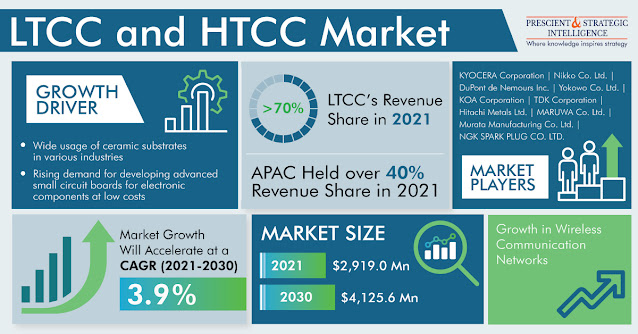
In 2021, the LTCC and HTCC market size stood at $2,919.0 million, and it is projected to grow at a CAGR of 3.9% from 2021 to 2030, to reach $4,125.6 million by 2030. This is ascribed to the increased industrial usage of ceramic substrates in sectors, including telecommunications, automotive, and consumer electronics. Moreover, the surging demand for low-cost small-circuit boards leads to the increased consumption of ceramic substrates. 

The most significant contributor to the revenue share of the LTCC and HTCC market was LTCC, amounting to 70%, in 2021. The category is expected to follow the same trend in the future as well. LTCC is defined as a ceramic substrate that facilitates high-frequency circuits. It has superior electrical and mechanical properties, such as limitless stacking, form-and-fit versatility, and high performance under extreme conditions, making it a better choice than HTCC. LTCC products are also utilized in wireless technologies and RF modules, facilitating regular communication.

LTCC and HTCC Market

The key LTCC and HTCC market players are contributing to the increased R&D activities in this field. They are investing a high amount in R&D for effective production processes of LTCC and HTCC products. For example, the electronic devices segment of Kyocera Corporation invested $174.8 million in 2021 in R&D activities, which was 17% higher than last year. The investment's primary goal was to enhance the electrical and electronic devices portfolio. 

The automotive sector acquired a significant share of the LTCC and HTCC market, amounting to 40% revenue generation, in 2021. The industry will also dominate the market in the coming years. This is ascribed to the surging demand for various automotive electronics, including telematics, and the increasing vehicle safety awareness. Moreover, countries such as Russia, India, Argentina, Thailand, and Brazil have a high demand for ceramics, due to the mass adoption of vehicle sensors and devices.

APAC held the largest share in the LTCC and HTCC market in 2021, attributing to the growing automotive and industrial electronics sectors in Japan, South Korea, India, and China. The demand for co-fired ceramics has increased over time, due to the rapid production of electronic products, which are extensively used in the telecommunications and automotive industries. 

Thus, the increased adoption of wireless technology has led to a boom in the market, with increased efficiency of 5G and 6G networks.

Share:

Why Will APAC Rule Low VOC Adhesives Market?

The low VOC adhesives market is predicted to touch $81.1 billion by 2030, since being valued at $47.6 billion in 2021. The market will grow at a 6.1% CAGR from 2021 to 2030 owing to the stringent regulations being imposed by the government to reduce the VOC content in products, coupled with the rising awareness of sustainability standards. For example, in 2020, there was an imposition of new VOC standards for corporations producing numerous commodities, including inks, cleaning products, coatings, and adhesives, in China.

Another major driver for the low VOC adhesives market is corporations’ investments in emerging economies, to launch new products. This trend is accompanied by an inclination toward low-carbon-emitting vehicles and a gradually growing awareness about green homes or smart homes. For example, the building of an Adhesive Technologies Innovation Center in Shanghai was announced by Henkel in 2021, with the total spending accounting for about $65 million. This was done to leverage the growing consumption of adhesives with a low VOC content by various industries.

Low VOC Adhesive Market

Within the end use segment, the paper & packaging category accounts for more than 30% of the overall low VOC adhesives market share. This can be credited to the rising requirement for sustainable and environment-friendly packaging commodities, including corrugated boxes. Furthermore, the Food and Drug Administration has allowed low-VOC adhesives to be used in food packaging. In addition, the green building and construction sector will fuel the market advance due to the extensive utilization of pressure-sensitive adhesive technology for flooring purposes, including vinyl and carpet floor tiles.

APAC will lead the low VOC adhesives market in the coming years due to the surging infrastructure spending, robust economic growth, and skyrocketing purchasing power of consumers. Moreover, the rising population and developing automotive sector will augment growth in the market, because of a increasing requirement for adhesives in the packaging, healthcare, and automotive sectors. Furthermore, being home to emerging economies, which have a stronger consumer base and economical labor costs, new manufacturing units of low VOC adhesives are being set up in the region.

Hence, the snowballing demand for these products in the packaging industry, coupled with rising vehicle safety standards, will create lucrative opportunities for the key players.

Share:

What are Key Factors Causing Boom of Hong Kong Wound Care Market?

People aged 65 or above have steadily risen in Hong Kong, from 0.46 million in 1988 to 1.27 million in 2018, as per government sources. The rising geriatric population is one of the key factors fuelling the demand for wound care products in the metropolis. This is mainly due to the fact that the elderly are more vulnerable to various chronic diseases, such as cancer, cardiovascular diseases, and neurological disorders. In addition to this, the whole process of wound healing takes more time in the geriatric population, due to the slower collagen production in their bodies and the reduced elasticity of their skin.

Due to these factors, theHong Kong wound care market industry is expected to generate $80.7 million revenue by 2030, witnessing a CAGR of 5.4% during the forecast period (2020–2030). There are two types of wound care products available in the megacity, advanced and traditional. Of these, the advanced wound care products, owing to their ability to induce swift healing with minimal discomfort to patients, are expected to record higher demand in the coming years.  

This is also why such products are currently a rage in the Hong Kong wound care market, and the preference of an increasing number of consumers is shifting toward advanced wound care therapies. The main reasons behind this shifting preference are the numerous advantages provided by such therapies and products, such as their ability to provide rapid healing and quick relief to the patients. Moreover, the advanced wound care procedures carry lower risks of infection, as compared to the conventional methods of wound care. For instance, Biatain alginate, offered by Coloplast A/S, is a highly absorbent alginate dressing, applied on moderate-to-heavy exuding wounds.

Hence, it can be concluded that owing to the soaring geriatric population and increasing occurrence of numerous chronic diseases and ailments in this global financial hub, the demand for wound care products and therapies will witness a massive growth in the coming years. 


Share:

Metaverse Market Witnessing Unimaginable Growth; To Cross $1.5 Trillion by 2030

The global metaverse market is driven by burgeoning investment in R&D activities, the rising adoption of the latest VR and AR solutions to develop patient output and the entire surgical atmosphere, and the snowballing demand for metaverse, thereby assisting in trading digital assets via cryptocurrency. In 2021, the market stood at $148.5 billion, and it is predicted to touch $1,542.9 billion by 2030. The market will witness a 29.7% CAGR because of the existence of highly competitive metaverse-focused companies being engaged in many partnerships and collaborations to develop a wide range of products.

The outbreak of COVID-19 had disrupted several markets globally, but the metaverse industry was one among the few exceptions: it exhibited magnificent figures amid the pandemic. The period not only witnessed the digital platform's reliability but also surged investments. Furthermore, lockdowns were imposed on several developing and developed nations, offering extravagant opportunities to the new market entrants. This is because they had more time available at home to focus on business credentials and strengthen the foundations of their business. For example, the number of Fortnite players increased by 100 million from 2019 to 2020.

Metaverse Market Analysis by P&S Intelligence 

The metaverse is an internet-based reality. As the metaverse market will expand, its Non-fungible token (NFT) are scarce and rare and will exhibit lucrative opportunities by growing from nothing to everything. Emerging ecosystems backed by blockchain technology will result in the generation of high revenue due to the authentication and traceability built on interoperable frameworks. A snowballing investment is made on improving the blockchain technologies and NFT by the real-estate dealers for a better reach among the young consumers through brand-building and to inculcate the trust of ownership.

The APAC metaverse industry will advance at the highest CAGR of at least 30% in the coming years. This can be credited to robust digitalization in South Korea, Japan, India, and China, coupled with the surging adoption of AR/VR to adapt to the current marke5t dynamics and shifts in tastes & preferences of consumers. Nonetheless, North America ruled the market in 2021 because of the swift integration of smart devices, snowballing demand for VR/AR, and surging requirements for smartphones.

Hence, the existence of highly competitive metaverse-focused corporations engaged in many partnerships and collaborations to develop a wide range of products will drive the market.
Share:

Military Communications Market Driven by Growing Concerns about Data Security

The military communications market is expected to witness growth owing to the rising security concerns. Due to an increase in the number of disputes among different countries across the world, there is a significant growth in the procurement of weaponry and military communication solutions. The increasing adoption of ad-hoc networking in unmanned vehicles as well as multi-mode and multi-band tactical radio systems will propel the demand for hardware and software that enable military communications.

Military Communications Market Report Says By P&S Intelligence 

The major driver for the military communications market is the growing concerns about data security in this digital world. Since the cyber resources on the ground, air, sea, and space are vulnerable to various threats, securing military equipment against cyberattacks has become increasingly crucial. The military sector is continuing to adopt secured ways to keep from such situations. For enhanced battlefield situational awareness and strategic communication between military officers and their juniors, there is a dire need for an advanced communication system.

Another major driver for the military communications market is the rising acceptance of wireless communication technology. Advanced communication technologies, such as SATCOM and ultra-high frequency communication, are replacing the existing wired communication systems, to build a stronger data security network. In addition, the U.S. is coming up with an inter-functional wireless system, which runs on the 5G network. It will connect all the military domains into a single matrix, thereby protecting critical equipment, such as missile systems, from the much-feared data security thefts.

APAC is expected to witness steep growth in the military communications market, attributed to a noticeable increase in warplane deliveries in developing nations, border threats from neighboring countries, and the adoption of network-centric warfare. Moreover, countries such as China, India, and Japan are rapidly building up their cyber warfare capabilities, which necessitates smooth data transmission. APAC being home to politically volatile countries is one of the fastest-growing markets for military communication solutions. For instance, India continues to engage in regular skirmishes with Pakistan and China on numerous issues. 

Based on communication, the airborne category will potentially become large. This may be attributed to the increasing focus and spending to improve the capabilities of air forces. Furthermore, the expenditure on airborne communications continues to rise as countries seek to improve their ground attack, strike, air superiority, and reconnaissance capabilities. For instance, the AWACS system is carried by a number of reconnaissance aircraft of the forces of India, the U.S., Australia, Israel, China, Great Britain, Japan, and many other countries.

Thus, the growing concerns about military data security and adoption of wireless technology will together propel military communications 
Share:

Popular Posts

Blog Archive