How is Need for Less-Harmful Alternatives to Tobacco Smoking Driving South Korean E-Cigarette Market?


Growing awareness about the ill-effects of tobacco smoke inhalation and technological advancements are leading to the growth of  South Korea e-cigarette market globally. From $874.3 million in 2018, the market is predicted to expand to $3.5 billion by 2024 at a 24.3% CAGR during the forecast period (2019–2024).
Electronic cigarettes do not contain tobacco, rather come with a nicotine solution in a refill or vial, which, on being burnt, creates mist instead of smoke.
The product segment of the South Korean e-cigarette market is categorized into t-vapor, vaporizer, vape mod, and cig-a-like. Among these, vaporizers dominated the market during the historical period (2014–2018) in terms of volume and value, as these offer a similar experience provided by traditional cigarettes.
While these will keep leading the market in the forecast period, t-vapors would experience the highest revenue CAGR (30.6%), with global brands competing intensely to capitalize on their growing popularity.
The various distribution channels for e-cigarettes in the country include vape shops, tobacconists, hypermarkets/supermarkets, and online platforms. Among these, hypermarkets/supermarkets, vape shops, and tobacconists accounted for almost 65.0% value share in the South Korea e-cigarette market in 2018.
During the forecast period, online channels will experience the fastest growth as manufactures are increasingly using them to sell their products. As the health effects of such products are still unclear, the national government increased the taxes on e-cigarettes by 117.0% in 2015, making manufacturers look for alternative sales platforms.
South Korea E-Cigarette Market Segmentation
Market Segmentation by Product
  • Cig-a-like
    • Disposable
    • Rechargeable
  • Vaporizer
    • Open tank
    • Closed system
  • Vape Mod
  • T-Vapor
    • Heat-not-burn
    • Infused
Share:

Bottled Water Market is Expecting Worldwide Growth

Drinking water packed in glass or plastic bottles is referred as bottled water. Bottled water may or may not be carbonated. Bottled water continues to be a popular choice of consumers despite the carbonated soft drinks having established. Water sold in large bottles holding one to 2.5 gallons is relatively cheaper compared to carbonated water sold at higher prices per gallon. Increasing inclination of consumers from high calorie carbonated soft drinks to low calorie healthier options, such as bottled water, are driving the growth of global bottled water market.

Bottled water contributes a large portion in the global soft drinks industry. With increasing responsiveness among consumers about being hydrated by drinking safe water is driving the growth of global bottled water market. The demand and consumption of bottled water varies significantly from one region to another region. Increasing economic stability and urbanization in developing countries, such as China, Brazil, India and Mexico, is generating demand for bottled water. In emerging countries, consumer awareness towards the safe and clean water had driven the growth of the bottled water market.

Availability of convenience packaging and inability of the governments to provide reliable and safe drinking water are various other factors persuading the growth of global bottled water market. Bottled water market is less affected by fluctuating prices of raw materials. As water, which is the prime raw material used, is found in abundance, the bottlers’ sales margin depends on the price of plastic used for making the bottles.

Geographically, Asia-Pacific dominates the global bottled water market, followed by Europe. However, developing countries in Asia-Pacific such as India and China are expected to be the fastest growing regional market of the bottled water during the coming years. The expansion of bottled water market in developing countries is attributed to shifting inclination in drinking habits toward more hygienic drinking alternatives, rising disposable income, high consumption volume of water, and growing consumption of functional water in the region.

Make Enquiry Before Buying the Report@ https://www.psmarketresearch.com/send-enquiry?enquiry-url=bottled-water-market

Some of the major players in the global bottled water market include PepsiCo Inc., Nestle Waters, Groupe Danone, Icelandic Water Holdings ehf, The Coca- Cola Company, Mountain Valley Spring Company, LLC, Hangzhou Wahaha Group Co., Ltd., Sunny Delight Beverages Company, and Balance Water Company.
Share:

Growing Popularity of Connected Cars to Drive European Autonomous Car Market


The increasing support from the government to popularize autonomous cars, inclusion of connected car technologies, and need for increased safety on the roads are driving the European autonomous car market. Autonomous cars, also sometimes known as driverless cars, are capable of functioning without or little human intervention, by sensing the surroundings and navigating safely. Among the two types of such cars — semi and fully — fully autonomous cars are expected to register a sale of 4 million units by 2030, at a CAGR of 37.4% during 2023–2030.


The inclusion of artificial intelligence (AI) in autonomous cars is trending in the European autonomous car market. Autonomous cars development has only been possible due to this technology. Features such as driver monitoring, speech recognition, gesture recognition, eye movement tracking, natural language interfaces, and virtual assistance are essential for a car to become autonomous. Further, AI was also instrumental in the development of the advanced driver-assistance system (ADAS), which has driver condition evaluation systems, camera-based machine vision systems, and sensor fusion engine control units.

The categories of the country segment of the European autonomous car market are the U.K., Spain, Germany, Italy, France, and Rest of Europe. Among these, more than 20.0% of volume share was held by Germany due to the presence of large original equipment manufacturers (OEMs), such as BMW and Volkswagen AG. Throughout the forecast period, Germany is expected to account for the highest sales and revenue in the market. OEMs are planning to equipping autonomous cars with superior features such as smart park assist, blind spot detection, and anti-lock braking system.

The European autonomous car market players can use the deployment of such vehicles for mobility-as-a-service (MaaS) to increase their revenue. Considering that the chances of accidents are high in traditional car sharing, service providers would ultimately adopt autonomous cars for better passenger safety. As these cars are quite expensive for privately ownership, mobility services would witness an increase in their adoption. Many players have already entered the market, for instance, Navya, a French startup, which launched its first autonomous taxi in 2018.

Therefore, the market for autonomous cars in Europe is expected to grow at a steady rate due to the rising demand for such cars in the region for sharing purposes.


european investment in autonomous vehicles
Share:

Global Share of Low Speed Electric Vehicle Market to grow nearly 8.2% by 2025

Global LSEV market is projected to reach $68 billion by 2025, the growth of the market is majorly driven by rising environmental awareness and increasing government support, according to P&S Intelligence.


Insights into market segments
On the basis of voltage, the global Low Speed Electric Vehicle market has been categorised into 24V, 36V, 48V, 60V, and 72V. Of these, 48V is the most preferred voltage category due to its preference in electric scooters as it provides an optimal power to price ratio. However, the fastest growth during the forecast period is expected from the 72V category, due to the rising demand for high-speed LSEVs which use this voltage level.
By type of two-wheeler, the LSEV market is categorised into electric scooter, motorcycle, bikes, kick scooter, and mono wheel. Among these, electric bikes held the highest revenue share in the market, valuing over 50% in 2017. Electric scooters can reach top-speeds of 25-50km/hr, and are comfortable for long distance commuting. These characteristics of electric scooters, coupled with their lower price when compared to electric motorcycles, would continue to drive their market growth during the forecast period.
Asia-Pacific is the largest LSEV market
Globally, Asia-Pacific is the largest market for low speed vehicles, followed by North America and Europe. The Asia-Pacific market is led by China, which accounted for the largest share in terms of revenue in 2017, valued at more than 90%. The size of the country, population, technological advancements, and government support in the form of subsidies and regulations have made the country a big LSEV market in the region. China is also the largest exporter of these electric vehicles in the world. However, the fastest growth during the forecast period is expected from India, due to low penetration of LSEVs in the country.
E-bikes is the largest product category in Europe
Europe is the second largest Low Speed Electric Vehicle market in the world. E-bikes account for a majority of electric vehicles sold in the region. The e-bike market in Europe has seen a significant growth during the last few years; Germany, France, and Italy are the largest e-bike markets in the region.
Electric Motorcycles is expected to witness the fastest growth in North America
x
E-bikes account for the majority of electric vehicle sales in the North American LSEV market. The markets for kick scooters and mono wheels are at a nascent stage in the region. However, these categories are increasingly being seen as convenient modes of transportation for short trips. In 2018, Bird Rides Inc, a U.S. based start-up firm, raised $100 million funding for shared electric scooter services. The company plans to expand to 50 new cities in the U.S. by the end of 2018.

Competitive Landscape
Some of the major players operating in the LSEV industry are Terra Motors Corporation, Zero Motorcycles Inc., Changzhou Yufeng Vehicle Co. Ltd., Jiangsu Kingbon Vehicle Co. Ltd., Hero Electric Vehicles Pvt. Ltd., Jiangsu East Yonsland Vehicle Manufacturing Co. Ltd., ZHIDOU Electric.
Share:

How will the market drivers, restraints and future opportunities affect the MEA Specialty Chemicals Market dynamics and a subsequent analysis of the associated trends?

The increasing consumption of various types of agrochemicals owing to the advancement of agricultural practices is expected to fuel the Middle East and Africa (MEA) specialty chemicals sector growth. Agriculture is a dominant niche considering economic output and also a prominent income source in African nations. Agrochemicals are used for improving the soil fertility and preventing crop damage, mainly from weed growth and pests. 


Further, major oil-producing nations, such as Nigeria, Saudi Arabia, and Iran, are engaging in the oilfield expansion in order to meet the rising requirement for the commodity, thereby resulting in significant growth of the sector. The MEA specialty chemicals market is witnessing rapid consolidation due to increasing merger and acquisition activities. For instance, in 2017, Saudi Basic Industries Corporation declared that it was focusing on nearly $6.0 billion business acquisition opportunities in specialty chemicals, petrochemicals, and fertilizers domains.

MEA has some of the largest oil producing countries in the world, namely, Saudi Arabia, Nigeria, and Algeria. These countries are also among the largest exporters of crude oil in the world and would continue to invest in the exploration and development of new oil fields. Owing to this, the demand for specialty chemicals used in oil fields is expected to rise in the region. Also, rising demand for specialty chemicals in the production of automotive lubricants is also expected to boost the MEA specialty chemicals market during the coming years.


The demand for the product in the developed countries of the region has reached the maturity stage, owing to the saturate demand from end user industries. However, the demand of specialty chemicals in developing countries, particularly in African nations, has witnessed a rapid rise in recent years, mainly from the agriculture, electronics, and construction sectors. This allows the manufacturers to tap the potential in these developing countries and offers high growth opportunities for the MEA specialty chemicals market.

Specialty chemicals are also known as performance chemicals. They are used as ingredients in the manufacturing processes of consumer and industrial goods. These are low volume chemical products, which add significant value to different products. These chemicals can be used for producing a variety of products, including detergents, paints, electronics, and petroleum products.
Share:

Steady Growth Predicted for Structured Cabling Market Globally


The global structured cabling market generated revenue of $7669.8 million in 2017 and is expected to witness a CAGR of 5.5% during forecast period (2018–2023). Advancements in information technology (IT) are positively influencing the growth of the market.

Business enterprises are actively optimizing their IT infrastructure by adopting more efficient solutions, including structured cabling. It is a network that handles information in the form of data, voice, and videos, and can even manage complex building management systems easily.

Structured cabling offers a simple approach to manage systems with complex data transfer routes via transmission solutions that enable users to send data, voice, and signals in a manner, helping them make the most of the data transfer rate. The structured cabling market is huge and has diverse areas of growth.

Usually, the copper cables used in structured cabling are shielded twisted pair (STP), foil screened twisted pair (FTP), and unshielded twisted pair (UTP) type. In 2017, copper cable and copper components jointly held the major revenue share (60.0%) in the structured cabling market.

Request Sample Copy of Report :: http://bit.ly/2mGkEdJ

Product, wire category, application, end use, and region are the segments of the market that allow for a better understanding of the domain. On the basis of product, the market is divided into copper cable, copper components, fiber cable, and fiber components.

The increase in the number of internet users and rapid adoption of digital services have led to an exponential increase in the volume of sensitive data collected by organizations. Here, structured cabling provides the facility of data transfer at a higher speed, which is aiding the structured cabling market growth.

Read more related reports:

India Structured Cabling Market
Share:

Expanding Cement Industry Aiding the Liquid and Air Filter Bags Market Growth

Increasing disposable income, stringent government policies, expanding cement manufacturing and mining industries, and rising environmental standards on water and air pollution are the key factors driving the growth of the liquid and air filter bags market. In 2017, the market generated a revenue of $4,220.2 million, and it is predicted to attain a size of $6,144.9 million by 2023, advancing at a CAGR of 6.5% during the forecast period (2018–2023), according to P&S Intelligence. Liquid and air filter bags are used in the filtration and removal of solids from liquids and gases.


On the basis of type, the liquid and air filter bags market is bifurcated into air and liquid. Of these, in 2017, the liquid filter bag type contributed more than 70.0% revenue to the market. Liquid filter bags are used in the filtration or removal of solids from liquids in areas such as adhesives, resins chemical, oils, bitumen, petroleum, food, paper, and water treatment. Hence, due to the wide range of applications, this type is expected to maintain its lead during the forecast period.

Based on bag size, the liquid and air filter bags market is classified into 7OD*32’’, 7OD*17’’, 4OD*14’’, and 4OD*8’’. In 2017, out of these, the 7OD*32’’ classification held the largest share of 30.0% in terms of sales volume and is predicted to dominate the market during the 2018–2023 period. This is ascribed to the amazing chemical compatibility, superior product quality, and cost-efficiency of such long filter bags over other bags. 
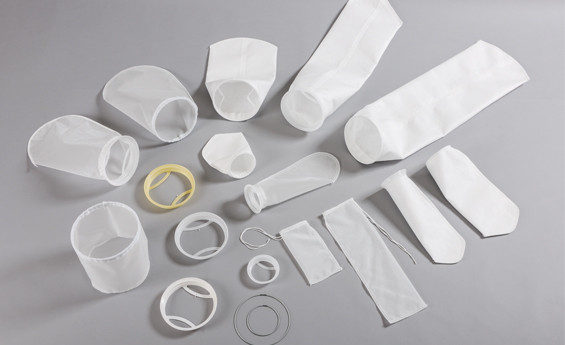


On the basis of end user, the liquid and air filter bags market is categorized into mining, steel and power, water treatment, chemicals and pharmaceuticals, cement, and others. Among these, in 2017, the chemicals and pharmaceuticals category contributed more than 31.0% revenue to the market. In this sector, liquid and air filter bags are widely adopted for removing dust and other unwanted foreign substances from the equipment machinery. This is why this end user is predicted to hold the largest share in the market during the forecast period.

Further, the demand for air and liquid filter bags from the mining industry and cement manufacturing facilities is growing. With the rise in infrastructure activities across the globe, there has been an increase in the setting up of mining and cement manufacturing industries. These industries use filter bags as a medium for removing the dust particles from the components, which are ultimately expelled into the air via chimneys during manufacturing process.


The government of various countries have started formulating regulations, such as the NESHAP (National Emission Standards for Hazardous Air Pollutants) in the U.S., for controlling harmful pollutants. Under this, manufacturing plants are required to attach filter bags on the equipment. If, in case the facility fails to follow the policies, it might be closed down. Thus, the rising adoption of the filtration process in the cement manufacturing and mining sector is boosting the liquid and air filter bags market growth.

Besides, the increasing usage of these bags in the pharmaceutical domain during processes such as filtration of gelatins, purification of carbon, and recovery of active ingredients, is expected to create immense opportunities for the players operating in the liquid and air filter bags during the forecast period. Another industry where these bags are used in huge amounts is automotive, with manufacturers attaching these to the engines of cars to protect them from harmful particles.

Hence, the expanding cement manufacturing and mining industries and rising adoption of these bags in pharmaceutical and automotive domains are strengthening the the market.
Share:

Popular Posts

Blog Archive