Showing posts with label Healthcare. Show all posts

Innovations in Battery-Operated Cleaning Equipment Propel Commercial Scrubbers and Sweepers Market Growth

According to the latest market research study published by P&S Intelligence, the global commercial scrubbers and sweepers market is on a robust growth trajectory, projected to reach USD 8.7 billion by 2030 from USD 4.7 billion in 2024, advancing at a compound annual growth rate (CAGR) of 10.6%. This expansion is driven by several factors, including rapid urbanization, increased industrialization, and heightened awareness of hygiene standards, particularly in the wake of the COVID-19 pandemic. The shift from traditional manual cleaning methods to advanced mechanized solutions has further accelerated the adoption of commercial scrubbers and sweepers across various sectors.

Technological advancements play a pivotal role in this market's evolution. Innovations such as battery-operated and robotic cleaning equipment offer enhanced efficiency, reduced environmental impact, and improved user convenience. These developments align with the growing emphasis on sustainability and operational efficiency in commercial cleaning practices.

To learn more about this report

Key Insights

Segmentation Analysis

The market is categorized into scrubbers and sweepers, with scrubbers holding the largest and fastest-growing segment. Within scrubbers, walk-behind models are prevalent in industries like healthcare, manufacturing, and logistics, while ride-on and robotic scrubbers are gaining traction in large-scale facilities due to their efficiency and labor-saving benefits.

Regional Trends

North America currently dominates the commercial scrubbers and sweepers market, attributed to stringent cleanliness regulations and widespread adoption across various industries. However, the Asia-Pacific region is expected to exhibit the highest growth rate during the forecast period, driven by rapid industrialization, urban development, and increasing investments in infrastructure.

Technological Advancements

The shift towards battery-operated machines is notable, with this segment anticipated to reach USD 4.5 billion by 2030, growing at a CAGR of 10.0%. These machines offer advantages such as portability, reduced emissions, and lower maintenance costs, making them increasingly popular in sectors like manufacturing, healthcare, and retail.

Competitive Dynamics

The market is fragmented, with numerous players offering a range of products catering to diverse cleaning needs. Key manufacturers are focusing on innovation, product differentiation, and strategic partnerships to enhance their market presence. The emphasis is on developing eco-friendly and technologically advanced cleaning solutions to meet the evolving demands of end-users.

Emerging Opportunities

The growing emphasis on hygiene and cleanliness in public spaces, healthcare facilities, and commercial establishments presents significant opportunities for market expansion. Additionally, the increasing trend towards automation and smart cleaning solutions is expected to open new avenues for growth, particularly in large-scale facilities and urban environments.
Share:

Project Portfolio Management Market Thrives on Digital Transformation and Expanding Enterprise Projects

According to the latest market research study published by P&S Intelligence, the global project portfolio management (PPM) market is on a dynamic growth trajectory, anticipated to escalate from USD 5,303.6 million in 2024 to USD 7,911.0 million by 2030, progressing at a CAGR of 6.9%. This upward momentum is largely fueled by the rising complexity of enterprise-level projects, which necessitates enhanced visibility and control over resource allocation, budgeting, and operational timelines.

A key contributor to this expansion is the increasing demand for advanced tools that facilitate seamless collaboration, real-time monitoring, and informed decision-making. As businesses globally strive to maximize returns from their project investments, PPM solutions are becoming indispensable in streamlining processes and improving outcomes.

In addition, the integration of cutting-edge technologies like artificial intelligence (AI) and machine learning (ML) into PPM platforms is transforming the landscape. These innovations empower organizations with predictive analytics and automation capabilities, enabling proactive management of resources and risks, and thereby significantly improving the efficiency and success rates of complex projects.

Download free Report Sample Now

Key Insights

  • The solutions segment is projected to maintain dominance in the PPM market in 2024, commanding approximately 60% share, driven by the need for robust tools to manage increasing volumes of project data and complexity.
  • The services segment, encompassing consulting, training, and managed services, is expected to witness the fastest growth at a CAGR of 7.2% during the forecast period, as organizations seek specialized expertise to implement and maintain PPM solutions.
  • On-premises deployment models currently lead the market with a 65% share in 2024, largely due to concerns around data privacy, internal compliance protocols, and control over IT infrastructure, particularly in sectors like government and BFSI.
  • Cloud-based deployment is rapidly gaining traction, projected to grow at a CAGR of 7.5%, owing to advantages such as scalability, lower upfront costs, remote access, and integration with other cloud services.
  • Large enterprises continue to dominate the market due to their broad project portfolios and higher IT budgets. They require agile and scalable solutions to manage interdepartmental workflows and cross-regional operations effectively.
  • Small and medium-sized enterprises (SMEs) represent a fast-growing segment, benefiting from the affordability and flexibility of cloud-based PPM tools that allow them to compete more effectively in their respective markets.
  • The BFSI sector holds the largest vertical share, around 40% in 2024, reflecting its extensive use of PPM tools for compliance, risk management, and digital transformation initiatives.
  • The healthcare sector is the fastest-growing vertical, driven by the digitization of patient data, increasing demand for health IT systems, and the need for efficient project delivery in clinical and administrative operations.
  • Geographically, North America leads the global PPM market, accounting for a 45% share in 2024. This dominance is underpinned by a robust IT infrastructure, early technology adoption, and the concentration of leading market players.
  • Asia-Pacific is emerging as the most rapidly expanding region, forecasted to grow at a CAGR of 8.0% through 2030, bolstered by the digital transformation of SMEs, rising investments in IT, and growing economic activities in countries like India and China.
  • The competitive landscape is highly fragmented, with major players such as Oracle Corporation, Planview Inc., Broadcom Inc., SAP SE, Microsoft Corporation, and Atlassian Corporation Plc actively expanding their portfolios through innovations and acquisitions.
  • Notable strategic moves include Oracle’s enhancement of its Primavera Unifier suite in August 2024 and ServiceNow’s acquisition of Raytion in July 2024, aimed at bolstering AI-powered knowledge management and search functionalities in PPM ecosystems.
Share:

Rising Demand for High-Precision Testing Fuels Optical Spectrum Analyzer Market Surge

According to the latest market research study published by P&S Intelligence, the global optical spectrum analyzer market is poised for significant growth, with its valuation expected to rise from USD 412.3 million in 2024 to USD 680.4 million by 2032, reflecting a compound annual growth rate (CAGR) of 6.5% during the forecast period. This surge is primarily driven by the escalating demand for precise optical measurements across various sectors, including consumer electronics, healthcare, and telecommunications.

The proliferation of internet users and the consequent need for higher bandwidth have compelled operators to invest in advanced testing solutions like OSAs. Furthermore, the customization of OSAs to cater to specific application requirements is emerging as a strategic approach to meet diverse industry needs. Major industry players are also enhancing their distribution channels to address the growing demand for these analyzers.

Download free Report Sample Now

Key Insights

Product Segmentation

OSAs are categorized into portable, handheld, and benchtop types. Each variant serves distinct applications, with benchtop models often utilized in laboratory settings, while portable and handheld versions are favored for field operations.

End-Use Industries

The primary sectors employing OSAs include telecommunications, healthcare, and consumer electronics. In telecommunications, OSAs are vital for network testing and maintenance. Healthcare applications involve precise measurements in medical diagnostics, while consumer electronics utilize OSAs for product development and quality assurance.

Regional Trends

North America currently holds the largest market share, attributed to its advanced technological infrastructure and significant investments in R&D. However, the Asia-Pacific region is projected to witness the fastest growth, driven by rapid industrialization, expanding telecommunications networks, and increasing adoption of advanced technologies in countries like China and India.

Technological Advancements

The evolution of 5G technology is a significant driver for the OSA market. The deployment of 5G networks necessitates the use of millimeter wave frequencies, requiring advanced OSAs for accurate measurement and analysis. Additionally, the development of affordable components using new semiconductor materials is facilitating the production of cost-effective OSAs.

Competitive Landscape

The OSA market is consolidated, with key players focusing on strategic initiatives such as product innovation, partnerships, and expansion of distribution networks to strengthen their market position and meet the growing demand across various industries.
Share:

Digital Transformation and Global Commerce Drive Machine Translation Market to New Heights

A new comprehensive market analysis report on the global machine translation market reveals substantial growth trajectories, with the market expected to achieve significant expansion at a CAGR of 5.02% during the forecast period of 2025-2032.

Market Overview

The machine translation market continues to evolve rapidly as organizations worldwide prioritize multilingual communication strategies to serve global customer bases. The transition from rule-based and statistical machine translation to neural machine translation (NMT) technologies has revolutionized the industry, delivering unprecedented accuracy levels and more natural-sounding translations across numerous language pairs.

Key Growth Drivers

Several factors are accelerating market growth:

  • Digital Transformation: The accelerating pace of global digital transformation has intensified the need for efficient, real-time translation capabilities across industries.
  • AI and Deep Learning Advancements: Continuous innovations in artificial intelligence, particularly in transformer models and contextual understanding, have significantly improved translation quality.
  • Expanding Global Commerce: Increasing cross-border business activities require seamless language translation for effective communication with international partners, suppliers, and customers.
  • Content Explosion: The proliferation of digital content has created unprecedented demand for scalable translation solutions that can process massive volumes of multilingual data.
  • Remote Work Normalization: Global distributed workforces require effective communication tools that bridge language barriers.

Market Segmentation Insights

  • By Technology: Neural machine translation dominates the market, outperforming traditional statistical and rule-based approaches in accuracy and fluency.
  • By Deployment Model: Cloud-based solutions continue to gain market share due to scalability advantages and lower infrastructure requirements, though on-premises solutions remain important in highly regulated industries.
  • By Industry Vertical: IT & telecommunications, healthcare, e-commerce, and government sectors represent the largest adoption segments, with financial services showing the fastest growth rate.
  • By Application: Content translation remains the primary use case, followed by customer service applications and internal communications.

Regional Analysis

North America currently leads the market, driven by extensive technology adoption and the presence of major industry players. However, the Asia-Pacific region is expected to witness the highest growth rate during the forecast period, fueled by rapid digitalization, expanding IT infrastructure, and increasing cross-border trade activities.

Competitive Landscape

The machine translation market features a mix of established technology giants and specialized language service providers. Key players are focusing on enhancing AI capabilities, expanding language pair offerings, and developing industry-specific solutions to maintain competitive advantages.

Future Outlook

Looking ahead, the machine translation market is positioned for continued innovation and expansion:

  • Integration of machine translation with other technologies like speech recognition, creating seamless voice-to-voice translation experiences
  • Increased focus on low-resource languages to address underserved markets
  • Development of multimodal translation systems capable of processing text, images, and audio inputs
  • Advancement of adaptive learning systems that continually improve translation quality based on user feedback
Share:

Rapid Growth in Drone Package Delivery Driven by AI and Tech

According to the latest market research study published by P&S Intelligence, the drone package delivery market is poised for significant growth, with projections indicating an increase from USD 686.7 million in 2024 to USD 4,661.3 million by 2030, reflecting a robust CAGR of 37.6%. This surge is driven by industries such as logistics, retail, agriculture, and healthcare integrating drone technology to enhance same-day delivery services. Drones offer expedited deliveries with high precision, minimizing human intervention and reducing labor costs through automation. Furthermore, the expansion of quick-service restaurants globally has amplified the adoption of drone deliveries to meet the rising demand for rapid service.​


Learn more about this report: https://bit.ly/3RuU8Pr

Key Insights

Segmentation Analysis:

·         The market encompasses solutions including platforms, services, infrastructure, and software.​

·         Delivery ranges are categorized into short, medium, and long distances.​

·         Package weight classifications include less than 2 kg, 2–5 kg, and over 5 kg.​

·         Wing types are segmented into fixed-wing, rotary-wing, and hybrid models.​

·         Operational modes are divided between partially-automated and fully-automated systems.​

·         End-users span sectors such as food and beverage, retail goods, postal services, healthcare, agriculture, manufacturing, weapons and ammunition, and shipping.​

Regional and Geographical Trends:

·         North America currently leads the market, attributed to technological advancements and supportive regulatory frameworks.​

·         The Asia-Pacific region is anticipated to experience the fastest growth, driven by increasing e-commerce activities and a growing emphasis on efficient delivery systems.​

Technological Advancements Shaping the Market:

·         Enhanced battery technologies are extending drone flight durations and ranges, reducing the need for mid-journey recharging.​

·         Integration of sensor technologies, including thermal and night vision cameras, is improving delivery accuracy and enabling operations in low-visibility conditions.​

·         Artificial intelligence applications are enabling drones to detect obstacles and calculate optimal delivery routes, enhancing efficiency and safety.​

Competitive Dynamics, Major Players, and Emerging Opportunities:

·         The market is characterized by a consolidated landscape with key players investing in research and development to innovate and capture market share.​

·         Companies are focusing on strategic partnerships and collaborations to expand their service offerings and geographical presence.​

·         Emerging opportunities lie in addressing regulatory challenges and developing infrastructure to support large-scale drone delivery operations.​

The integration of drone technology into package delivery systems is revolutionizing the logistics landscape, offering faster, more efficient, and cost-effective solutions to meet the evolving demands of consumers and industries alike.

Share:

AI & Cloud Drive Growth in Video Conferencing Industry

According to the latest market research study published by P&S Intelligence, the global video conferencing market is poised for substantial growth, with projected revenues reaching USD 11.2 billion in 2024 and an anticipated compound annual growth rate (CAGR) of 9.8%, culminating in USD 19.5 billion by 2030.

This expansion is driven by the increasing adoption of virtual communication tools that enable businesses to maintain a competitive edge through seamless team interactions. Cloud-based video conferencing solutions are particularly contributing to this trend, offering cost-effective alternatives to traditional on-premises systems by eliminating expenses associated with hosting, IT support, and hardware maintenance. These solutions enhance productivity, efficiency, and engagement while reducing time and budget constraints. Furthermore, advancements in technology, such as the integration of artificial intelligence (AI), are propelling the market forward to meet the evolving demands of remote collaboration and flexible work arrangements. 


Download free Report Sample Now

Key Insights

Component Analysis:

The hardware segment is expected to command a 55% market share in 2024, fueled by the proliferation of smartphones, laptops, and personal computers equipped with high-resolution cameras, speakers, and microphones.​

The software segment is projected to experience a higher CAGR of 10% during the forecast period, driven by the demand for uninterrupted video conferencing solutions, particularly among enterprises with geographically dispersed teams. AI-driven software enhances security and privacy in video conferences.​

Conference Type Analysis:

The telepresence category is anticipated to hold a 35% market share in 2024, offering users a realistic experience that simulates being in the same room as other participants.​

Desktop video conferencing is expected to grow at the highest CAGR of 10%, attributed to its facilitation of short, informal business meetings, ease of installation, user-friendliness, and minimal operational complexity.​

Application Analysis:

Enterprises are projected to account for 80% of the market share in 2024, as both large and small businesses increasingly utilize video conferencing services to communicate with employees and customers, enhancing client experiences and operational efficiency.​

The consumer segment is expected to grow at a higher CAGR of 10.5%, driven by the rising adoption of online education and remote medical consultations.​

Deployment Mode Analysis:

On-premises deployment is forecasted to hold a 70% market share in 2024, favored by large enterprises for its data security benefits and ability to address issues related to internet reliability, latency, and bandwidth.​

Cloud deployment is anticipated to grow at a higher CAGR of 12%, as cloud-based solutions reduce operational costs and offer organizations flexibility and enhanced productivity without the need for additional software.​

Vertical Analysis:

The IT & telecommunication sector is expected to capture a 30% market share in 2024, driven by the shift toward hybrid work models that necessitate video conferencing for communication, seamless data sharing, collaboration, and increased operational efficiency.​

The education sector is projected to grow at the highest CAGR of 10%, due to the rapid adoption of online education and distance learning programs requiring advanced video conferencing solutions to maintain teacher-student connections.​

Regional Analysis:

North America is anticipated to hold a 40% market share in 2024, attributed to the presence of established service providers like Google, Cisco Systems, and Microsoft Corporation, as well as the widespread adoption of BYOD (Bring Your Own Device) solutions increasing the demand for high-quality video conferencing.​

The Asia-Pacific (APAC) region is expected to grow at the highest CAGR of 12.5%, driven by rapid technological advancements, digitalization across industries, improved connectivity through 5G networks, and the adoption of long-distance education programs necessitating advanced video conferencing systems.​

Competitive Landscape:

The global video conferencing market is consolidated, with major players such as Cisco Systems Inc., Zoom Communications Inc., and Google LLC capturing significant market shares.​

Companies are integrating AI and machine learning (ML) technologies to enhance their offerings and maintain competitiveness.​

Strategic collaborations, acquisitions, and partnerships are prevalent as companies seek to strengthen their market positions.​

Emerging Trends:

The integration of new technologies, including AI, virtual reality (VR), real-time language translation, live captions, motion backgrounds, avatars, and sound effects, is enhancing user experiences in video conferencing. AI provides solutions such as schedule management and pre-meeting preparation suggestions.​

The rise in hybrid work models is driving the adoption of effective communication solutions, as employees seek flexible schedules that boost productivity and work-life balance. Video conferencing plays a crucial role in facilitating communication within hybrid work environments.​

Security and technical issues remain challenges, as mishandled video calls can lead to financial losses, legal issues, and reputational damage. Poor connections may cause accessibility delays and reduced operational efficiency.​
Share:

AI and Laser Tech Fuel Growth in U.S. Home-Use Beauty Devices Industry

According to the latest market research study published by P&S Intelligence, the U.S. home-use beauty devices market is projected to experience significant growth, reaching USD 45.1 billion by 2032, growing at a CAGR of 27% from its 2024 size of USD 7.4 billion. This growth is driven by a surge in skin problems, hormonal imbalances, and rising consumer interest in wellness and personal care. Moreover, technological innovations are enhancing the convenience, cost-effectiveness, and efficiency of these devices. The increasing adoption of advanced beauty technologies like laser/light, AI, and IoT is further fueling demand, particularly among consumers seeking salon-quality results at home. Additionally, rising disposable income, a booming geriatric population, and urbanization are contributing to this market expansion.

The home-use beauty devices sector is gaining traction as more consumers prioritize skin rejuvenation, acne treatment, and anti-aging solutions. In 2024, hair removal dominated the market, driven by cost-effective and user-friendly devices. Technological advancements such as AI-powered beauty devices are making personal care routines more intuitive and accessible, allowing for customized skin treatments based on real-time assessments.


Download free Report Sample Now

Key Insights

Segmentation Analysis:

Hair removal held the largest market share of 25% in 2024, with increasing adoption of at-home IPL and laser hair removal devices.

Skin rejuvenation is expected to grow at the highest CAGR of 28%, driven by increasing demand for non-invasive treatments like LED light therapy and RF devices.

Other significant categories include acne treatment, facial steaming, and cellulite reduction, catering to the growing demand for comprehensive home beauty solutions.

Regional and Geographical Trends:

The Northeast region is currently the largest market and is also expected to be the fastest-growing region during the forecast period, driven by high consumer spending on beauty and wellness.

The overall U.S. market is fragmented, with multiple players focusing on different beauty needs, from anti-aging to skin health.

Technological Advancements Shaping the Market:

The laser/light technology category dominated in 2024, holding 60% of the market share, and is set to grow at a 30% CAGR due to its non-invasive nature and effectiveness in hair removal and skin rejuvenation.

AI integration is transforming the user experience, enabling real-time skin analysis and personalized skincare routines. Devices like Xiaomi’s Mi Smart beauty facial massager are gaining popularity, providing AI-based skin assessments and tailored treatment recommendations.

Competitive Dynamics and Emerging Opportunities:

Major players like FOREO and YA-MAN are introducing innovative beauty devices, such as the FOREO UFO 3LED for deep hydration and anti-aging treatments.

The growing interest in at-home beauty solutions presents opportunities for emerging companies to innovate with user-friendly, high-tech beauty devices catering to a broader range of skin issues.

With high upfront costs being a concern for some consumers, opportunities exist to make devices more affordable and accessible to the lower- and middle-income groups.

Additionally, products incorporating smart technologies that connect with mobile apps for better user control and feedback are gaining traction, enhancing the overall consumer experience.

Share:

Cloud Enterprise File Synchronization and Sharing Solutions Drive Market Growth Worldwide

The global enterprise file synchronization and sharing (EFSS) market is poised for significant growth, with projected revenues escalating from USD 14.0 billion in 2024 to USD 113.0 billion by 2032. This substantial increase corresponds to a compound annual growth rate (CAGR) of 29.7% during the forecast period.

A key driver of this expansion is the escalating need for secure data management solutions. Organizations are increasingly prioritizing privacy and data protection, leading to the adoption of EFSS platforms that offer robust security features, including access controls, encryption, and comprehensive audit trails.

Additionally, the demand for cloud-based EFSS solutions is surging due to their cost-effectiveness, scalability, and seamless integration capabilities. These solutions facilitate real-time collaboration and are easily deployable, making them attractive to enterprises aiming to enhance operational efficiency.

Get Your Free Sample Report Here: https://bitl.to/3kdB


Key Insights

Segmentation Analysis

The EFSS market is segmented by offering into software and services. The software segment includes integrated solutions that provide functionalities such as file storage, sharing, and collaboration tools. The services segment encompasses professional services like consulting, integration, and maintenance, which support the effective implementation and operation of EFSS solutions.

Application Diversity

EFSS applications are diverse, catering to various business needs. Key applications include document collaboration, which is the largest application category, enabling teams to work together efficiently on shared documents. Other applications involve file storage and backup, content management, mobile access and productivity, and analytics and reporting, all contributing to enhanced business processes.

Regional Trends

North America currently holds the largest market share, attributed to the early adoption of advanced technologies and the presence of major EFSS providers. Meanwhile, the Asia-Pacific region is anticipated to experience the fastest growth, driven by increasing digitalization efforts and the rising need for secure data management solutions across various industries.

Technological Advancements

The integration of EFSS platforms with other enterprise applications, such as Slack and Microsoft Teams, is a notable trend. This integration facilitates the creation of modern digital workspaces, allowing users to share, access, and collaborate on documents directly within their workflow applications, thereby enhancing productivity and user experience.

Competitive Landscape

The enterprise file synchronization and sharing (EFSS) market features a competitive landscape with the presence of several major players driving innovation and growth. Below are the top 10 key players in the market:

  1. Citrix Systems Inc.
  2. Dropbox Inc.
  3. Microsoft Corporation
  4. Google LLC
  5. Thomson Reuters Corporation
  6. IBM Corporation
  7. Broadcom Inc.
  8. Acronis International GmbH
  9. Thru Inc.
  10. Kiteworks USA LLC
  11. Syncplicity LLC
  12. Egnyte Inc.       
The EFSS market's robust growth trajectory underscores the increasing importance of secure and efficient file synchronization and sharing solutions in the modern enterprise landscape. As organizations continue to prioritize data security and operational efficiency, the adoption of advanced EFSS platforms is expected to rise, fostering further innovation and competition within the market.
Share:

Corporate Communication Agencies Drive Stakeholder Engagement Growth

The U.S. corporate communications market is forecasted to reach $2,204.2 million by 2024, with a strong compound annual growth rate (CAGR) of 14.0%, driving its value to $4,838.1 million by 2030. This remarkable growth underscores the growing reliance on strategic communication to enhance stakeholder engagement and achieve business success.

Corporate communication agencies provide essential services, including media relations, content creation, and crisis management, which are becoming integral to organizational strategies. Additionally, the adoption of advanced technologies like artificial intelligence (AI), virtual communication platforms, and data analytics is reshaping the industry, empowering companies to safeguard their brand image and address challenges effectively.

Download Free Sample Report Now

Key Insights

Segmentation Analysis

The market is segmented into internal, external, and unified communication categories:

  • Internal Communication: Aims to boost transparency and collaboration among employees.
  • External Communication: Focuses on managing public perception, media relations, and brand reputation.
  • Unified Communication: Integrates multiple platforms to streamline operations and enhance efficiency, gaining significant popularity.

The IT and telecom industry emerges as the largest application area, driven by its need for robust communication strategies to handle complex stakeholder interactions and stay competitive.

Regional Trends

The Western U.S. dominates the market due to its high density of tech firms and startups prioritizing cutting-edge communication tools. It is also the fastest-growing region, reflecting an increased demand for innovative and dynamic solutions.

Technological Advancements

Emerging technologies like AI and machine learning (ML) are revolutionizing corporate communication. Tools like generative AI (e.g., ChatGPT) create personalized content and analyze consumer behavior, while chatbots and conversational AI ensure timely and accurate interactions. Moreover, companies are exploring virtual reality (VR) to design immersive brand experiences that boost engagement.

Competitive Dynamics

The market comprises a wide range of players offering customized communication solutions. Leading firms are leveraging strategic partnerships and technological advancements to expand their market share. Digital transformation is a key focus, enabling businesses to remain competitive in a rapidly evolving environment.

Overall, the U.S. corporate communications market has become a cornerstone for businesses aiming to connect effectively with stakeholders, presenting vast growth opportunities through innovation and the adoption of advanced technologies.

Share:

How AI and Immersive Technologies are Shaping the Future of Visual Computing

The global visual computing market is poised for significant growth, with revenues projected to rise from $39.6 billion in 2024 to $110.3 billion by 2030, reflecting a compound annual growth rate (CAGR) of 18.9%.

Explore Insights with a Free Sample Report

This expansion is driven by the increasing adoption of hardware and software solutions that facilitate the creation and representation of images, videos, and animations through computational methods, including 2D and 3D rendering. Advancements in display technologies and their applications across various industries further contribute to this upward trajectory. Notably, sectors such as gaming, media and entertainment, healthcare, automotive, manufacturing, and defense are leveraging visual computing to enhance user experiences and operational efficiencies.

Key Insights

Segmentation Analysis:

    • Component: The hardware segment dominates the market and is anticipated to generate approximately $70 billion in revenue by 2030. This is attributed to the high demand for powerful GPUs, graphics cards, CPUs, and specialized processors that enable real-time interactive graphics, delivering immersive experiences. The growing popularity of interactive experiences in e-sports and online games further fuels this

Display Platform:

    • Interactive Video Wall: This segment holds the largest market share, owing to its extensive applications in control rooms, airports, and retail environments. Interactive video walls create dynamic, engaging visuals that enhance communication and advertising effectiveness.
    • Interactive Kiosk: Projected to experience a CAGR of 20% during the forecast period, interactive kiosks are increasingly utilized across retail, healthcare, transportation, and hospitality sectors. They offer convenience and improved user engagement, contributing to their rapid adoption.

Industry Application:

    • Gaming: Accounting for 55% of the market revenue in 2024, the gaming industry is a significant contributor to the visual computing market. The demand for high-quality, immersive gaming experiences drives the adoption of advanced GPUs, ray tracing technology, and AI-powered image enhancement. The shift towards 4K and VR gaming necessitates high-end hardware solutions, underscoring the importance of visual computing in this sector.

Regional and Geographical Trends:

    • North America: Currently the largest market for visual computing, driven by technological advancements and high adoption rates across various industries.
    • Asia-Pacific: Identified as the fastest-growing region, with a significant CAGR anticipated during the forecast period. Factors such as rapid industrialization, increasing investments in technology, and expanding gaming and entertainment sectors contribute to this growth.

Technological Advancements:

    • The integration of artificial intelligence (AI), particularly machine learning and motion planning, is revolutionizing visual computing. AI algorithms enhance tasks like object detection, image recognition, and motion tracking, making them more precise and real-time. For instance, NVIDIA's GeForce RTX 40 SUPER Series GPUs, built on the Ada Lovelace architecture, offer AI-generated capabilities that significantly improve creative and gaming performance.

Competitive Dynamics and Emerging Opportunities:

    • The visual computing market is characterized by fragmentation, with numerous companies offering diverse solutions across categories such as computer graphics, image processing, and AI. This fragmentation is driven by rapid technological advancements and the entry of startups with specialized offerings. Emerging opportunities are evident in sectors like autonomous vehicles, where visual computing plays a crucial role in navigation and decision-making, and in manufacturing and defense, where predictive maintenance and real-time analytics are becoming increasingly important.
In summary, the visual computing market is on a robust growth trajectory, propelled by technological innovations, expanding applications across various industries, and increasing demand for immersive and interactive user experiences.
Share:

Rising Demand for Cloud-Based Compensation Software to Propel Market to $5.62 Billion by 2030

The global compensation software market is projected to generate $3.22 billion in revenue in 2024, with expectations to reach $5.62 billion by 2030, reflecting a compound annual growth rate (CAGR) of 9.8% during the forecast period from 2025 to 2030. This growth is primarily driven by the increasing adoption of cloud-based solutions, which offer advanced features, scalability, and ease of workforce management. Additionally, the rising trend of remote and hybrid work models necessitates efficient compensation management systems to ensure equitable and competitive pay structures. The integration of artificial intelligence and machine learning into compensation software is further enhancing decision-making processes, contributing to market expansion.


Key Insights

The compensation software market is segmented by offering into solutions and services. The solutions category dominates the market, attributed to the increasing adoption of software that centralizes, streamlines, and automates employee data, aiding in the creation of competitive compensation packages compliant with company pay standards. These solutions assist managers and HR professionals in managing employee compensation, including salaries, bonuses, and benefits, and provide tools for creating dashboards and graphics to present critical data such as pay equity, sales incentives, and merit bonuses.

In terms of deployment type, cloud-based compensation software is experiencing significant growth due to its advanced features compared to traditional on-premises solutions. Cloud-based platforms offer organizations scalability and ease in managing their workforces, along with updates and technical support that allow HR departments to focus on core tasks rather than IT maintenance. These platforms can be accessed by employees and HR teams from anywhere, facilitating hybrid work modes, and offer real-time monitoring and data analytics required for regular automatic updates. Additionally, they provide data protection and privacy through data redundancy, multi-factor authentication, and encryption.

Geographically, North America holds the largest market share, driven by the early adoption of advanced technologies and a strong focus on employee satisfaction and retention. The Asia-Pacific region is expected to witness the fastest growth, propelled by increasing investments in digital transformation and the rising adoption of cloud-based solutions. The growing number of small and medium-sized enterprises (SMEs) in this region is also contributing to the demand for efficient compensation management systems.

Technological advancements are significantly shaping the compensation software market. The integration of artificial intelligence and machine learning is enhancing decision-making processes by providing predictive analytics and insights into compensation trends. These technologies enable organizations to design competitive compensation packages that align with market standards and employee expectations. Furthermore, the development of user-friendly interfaces and mobile applications is improving accessibility and user experience, encouraging wider adoption among organizations of varying sizes.

The market is characterized by fragmentation, with numerous players offering diverse solutions tailored to different organizational needs. Key companies are focusing on strategic initiatives such as mergers, acquisitions, and partnerships to expand their product portfolios and global reach. The increasing emphasis on employee satisfaction, retention, and the need for transparent and equitable compensation practices present significant opportunities for innovation and growth within the compensation software market. As organizations continue to navigate the complexities of modern workforce dynamics, the adoption of advanced compensation management systems is expected to play a crucial role in achieving strategic human resource objectives.
Share:

Navigating Healthcare's Ever-Changing Landscape with Consulting Firms

In 2023, the worldwide healthcare consulting services market recorded a revenue of USD 31.7 billion. Forecasts predict a robust compound annual growth rate (CAGR) of 11.4% from 2024 to 2030, ultimately reaching a projected value of USD 66.6 billion by 2030.


This can be credited to the growing rate of healthcare digitalization, brand positioning, aggressive marketing, and acceptance of new techs in medical sciences. Furthermore, the positive changes in the healthcare IT landscape because of the robust backing by the government in emerging nations boost the industry.

The industry for consulting facilities is growing mainly because of the fast acceptance of digitalization. Furthermore, key companies offering healthcare services are focusing on bringing technical improvements for offering precise and competitive data to healthcare providers. 

The digital health consulting category will advance at the fastest rate during the forecast period. This is mainly because of the acceptance of new techs in the medicinal field, mainly digital solutions over paper-based administrative methods in developed nations. 

In 2023, the North American region has experienced the largest share, of approximately 45%, and it is projected to show a strong CAGR during the forecast period. This is mainly because of the ample government funding for the making of nationwide and state-wide healthcare data exchanges, and also the increasing acceptance of healthcare IT solutions. 

Moreover, the high acceptance of digital solutions by public healthcare agencies, biotechnology & pharmaceutical businesses, hospitals, and other related establishments makes the region lucrative for healthcare consulting businesses.

Share:

Skin Replacements and Substitutes Industry Growth and Future Analysis

In 2023, the skin replacements and substitutes market brought in revenue totaling USD 1,178.2 million. With a projected compound annual growth rate (CAGR) of 7.0% from 2024 to 2030, it is anticipated to reach USD 1,869.2 million by 2030. This is mainly because of the increasing expenditure on appearance, growing populace, rising occurrence of burns and skin illnesses, and mounting life expectancy throughout the globe.


The growing burns occurrence is one of the sturdiest propellers in the industry. The WHO says that around 0.18 million individuals die of burns each year, while in India alone, more than 1 million individuals are affected by them.

The count of burn cases is lesser in high-income nations, while it is a key reason for disability-adjusted life years in low- and middle-income nations. Additionally, non-deadly burns are a key cause of illness. The mainstream of the cases is reported in homes and offices, among which most happen accidentally.

On the basis of product, the acellular category is projected to lead the skin replacements industry, with a revenue share of approximately 45% in 2030. An acellular skin replacement can be achieved in any demographic. It is suitable for the pediatric population, and it can be utilized in excised and insincere wounds.

Geographically, in 2023, the North American region will lead the industry, with approximately USD 0.6 billion in revenue, because of the growing expenditure on skincare, rising awareness of the appearance of advancing treatments obtainable, the growing pace of improvements in healthcare tech, and the existence of sophisticated medical facilities.

Share:

APAC Is Dominating Cryogenic Pump Market

In 2021, the cryogenic pump market size stood at USD 1,407.6 million, which is projected to witness a 3.1% CAGR during 2021–2030, reaching USD 1,860.1 million by 2030

P&S Intelligence majorly credits this growth to the increasing installation of such pumps in the metallurgy, chemicals, and electronics sector. Along with, the surge in expenditure throughout the energy generation industry armed with the shift toward energy production from renewable and natural gas resources to reduce carbon emission.

The nitrogen category is all set to experience the fastest growth rate of approximately 3%, in the near future. This can be owed to the extensive utilization of nitrogen gas for the maintenance of plants, and start-up and shutdown provisions of refineries and petrochemical companies.

Thus, the increasing utilization of nitrogen gas in numerous industries, including metallurgy, healthcare, and oil and gas, is escalating the acceptance of cryogenic pumps for capturing the gas and its vapor from the base.

The oil and gas sector is the largest utilizer of cryogenic pumps in the industry, owing to the increasing production of natural gas because of its rising demand from the special chemical, petrochemical, fertilizer, and refining industries.

In 2021, APAC cryogenic pump market  was largest revenue generator, with USD 538.2 million, and projected to continue its dominance in the future as well. This can be credited to the rapid urbanization; the growth in industries, including energy & power and metallurgy in Japan, China, and India, and the escalation in the requirement for power across the region. Additionally, in India, the government is preparing to guarantee a 24*7 electricity supply.      

In order to get this target, the country needs to improve its energy generation systems. Therefore, the government is focusing more on natural gas-fired power plants, which, indeed, will grow the demand for cryogenic pumps in the coming few years.

Hence, the increasing installation of such pumps in the metallurgy, chemicals, and electronics sector, the demand for cryogenic pumps will increase in the future.


Share:

Transdermal Drug Delivery Systems Market is Led by the North American Region

The total value of the transdermal drug delivery systems market was USD 4.2 billion in 2023, and it will power at a compound annual growth rate of 4.7% by the end of this decade, to touch USD 5.8 billion in 2030.

Transdermal Drug Delivery Systems Market Growth Report 2030

The sector is mostly driven by the rising incidence of chronic illnesses, and for the same, a conservative drug delivery system is weaker than required due to hepatic first-pass metabolism.  What is meant by this is that, when utmost oral drugs enter the liver, they are mostly digested before reaching the targeted tissue, therefore bringing about insufficient efficacy.

More than one billion people at a global level smoke cigarette, with incidence continuing to be high in spite of surveillance, educational, and supply restriction efforts on the international and national levels.

This factor is driving the requirement for transdermal nicotine patches for ages.  If the reports are to be believed, as opposed to a placebo administered for a year, nicotine patches are 50–60% more successful in helping individuals give up cigarettes.

North American transdermal drug delivery systems market is the leader. The expansion in this continent is chiefly driven by patent expirations, letting more businesses to enter the industry with generic alternatives of these devices.

Also, the relaunch of previously failed drugs for subcutaneous delivery and the vast spending by the stalwarts on related research and development are key reasons for the substantial share seized by this region.

Due to the growing incidence of chronic illnesses all over the world, the demand for transdermal drug delivery systems is on the rise. This trend will continue in the years to come as well. 

Share:

Auto Injectors Industry was Led by the North American Region

According to the latest market research study published by P&S Intelligence, the auto injectors market made a total revenue of USD 1,011 million in 2023, and it will propel at a rate of 14.8% in the years to come, to touch a value of USD 2640.2 million in 2030.

Auto Injectors Market Growth and Forecast Report, 2030


The key factors powering the industry expansion include the mounting requirement for the drug administration ease, growing incidence of chronic and lifestyle associated diseases, and evolving healthcare technologies.

According to the WHO, over 16 billion injections are given on a yearly basis at a global level. So, the rising need for ease and safety throughout the procedure is powering the advance of the industry.

North America is the leader of auto injectors market, and this prominent position will persist in the years to come as well. This is for the reason that the continent provides ready reimbursement for the use of autoinjectors. Furthermore, the growing occurrence of anaphylactic shock will encourage the acceptance of auto-injectors filled with epinephrine. Moreover, the two nations in the region exhibit a high awareness with regards to self-administration drug delivery devices.

The fastest growth is observed by the APAC region, chiefly as a result of the growing occurrence of diabetes. Since diabetics need normal insulin administration, auto-injectors save the trouble of seeing a medic every time and, therefore, make them independent. 

Moreover, the mounting occurrence of severe reactions as a result of food allergies is driving the requirement for epinephrine injections.

Due to the increasing occurrence of lifestyle and chronic diseases all over the world, the demand for auto injectors is on the rise. This trend wil continue in the near future as well.

Share:

North America Is Dominating Active Implantable Medical Devices Industry

The market size for active implantable medical devices was valued at USD 22.5 billion in 2023 and is projected to grow to USD 37.1 billion by 2030, with a compound annual growth rate of 7.5% from 2024 to 2030.

Active Implantable Medical Devices Market Report 2030

The occurrence of chronic illnesses is increasing, the population is rapidly aging, cardiovascular and neurological illnesses are becoming more dominant, and the implantable medicinal device tech is advancing. Apart from such reasons, the industry advance is aided by the increasing funding to develop technically advanced items, increasing acceptance of neurostimulators, and growing growth in and awareness regarding medical implants.

The rising aging population is one of the key reasons behind the development of this sector. According to the World Health Organization, 2 in 12 people worldwide will be 60 years old or more by 2030. By this time, the count of individuals who are 60 years and older will touch 1.4 billion from 1 billion in 2020. Furthermore, the number of people who are 80 years or older will triple in 2020–2050 and touch 426 million.

In 2023, the hospital category, based on end users, dominated the market. This can be credited to the huge aged population and the surging occurrence of chronic illness, the requirement for healthcare facilities is increasing. 

Hospitals face an increased influx of patients, leading to greater demand for medical equipment used in patient monitoring, treatment, and diagnosis. Additionally, hospitals often provide specialized procedures and therapies necessitating specific equipment.

In 2023, based on product, the implantable cardioverter defibrillators category was the major contributor to the market. This growth can be credited to the growing count of people with cardiovascular diseases worldwide, the growing requirement for such life-saving apparatus in developing nations, and the arrival of tech technical innovations in such devices.

Share:

Surface Computing Market is Led by North America

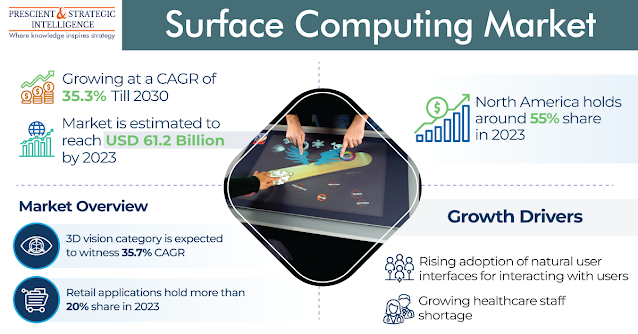
The surface computing market was USD 61.2 billion in 2023, and it will rise to USD 505.5 billion, powering at a 35.3% compound annual growth rate, by 2030.

Surface Computing Market Growth and Future Analysis
To learn more about this report: https://bit.ly/3NTBNKA

This growth is mainly because of the surging use of natural user interfaces for interacting with users. Additionally, surface computers have multi-touch as well as multiuser technologies, which assist in the identification of various objects physically with the help of touch. 

Moreover, they are employed for different applications, such as revolving, resizing, choosing, and moving, allowing the identification of objects in real-time.

The curved category, on the basis of display type, is likely to advance at a higher rate, of 35.6%, in the years to come. This can be because these devices have developed visual quality, enhanced efficiency, and reduced eye strain.

North America is the largest contributor to the industry, and it will remain the largest, generating USD 33.6 billion, by 2030. This can be mainly because of the increasing disposable salary as well as the existence of major companies.

APAC is likely to advance at the highest rate, of 35.8%, during this decade. This is because of the rising acceptance of innovative and new technologies, the growing need of customers for more immersive experiences in the digital world, and high funding by several tech giants in this region. 

With the increasing acceptance of natural user interfaces for interacting with users, the surface computing industry will continuously advance in the coming years.

Share:

North America was the Leader of the Multiplex Assays Market

The multiplex assays market produced USD 3,918 million revenue in 2023, and it will power at a rate of 9% by the end of this decade, touching USD 7,103.5 million by 2030.

Multiplex Assays Market Research Report 2030
To learn more about this report: https://bit.ly/4aNVHAn

The main factor powering the industry is the growing incidence of chronic ailments and infectious diseases. Also, the growing requirement for effective analytical platforms in research and medical diagnostics, to decrease the costs for researchers, healthcare providers, and patients, is a robust contributor.

On the basis of product, the consumables category led the industry with a share, of 45%, in 2023. It was because of the increase in the count of diagnostic tests and surge in research actions by life sciences companies.

For example, in January 2023, Novo Nordisk, a pharma company, publicized a USD 6-million grant for Durham Technical Community College, for supporting the later’s life sciences program and set up a novel training center with area of 35,000 square feet.

The protein-based category led the multiplex assays market, with a 50%, share in 2023, due to the growing applications of these kinds of products in proteomics studies. Furthermore, protein-based assays are extensively used in research to recognize the protein concentration, electrophoresis, cell biology and other analytes.

The flow cytometry category led the industry in 2023, because of the numerous applications of this tech in the discovery and measurement of proteins and RNA and in the assessment of cell health.

For instance, Life Sciences Core Facilities, the Flow Cytometry Unit, Weizmann Institute of Science’s is making the use of imaging flow analyzers that combine the high-amount quantification of flow cytometry with microscopy and aid in the study of post-translational alterations and protein, protein interactions in different contexts.

North America led the industry with a share of 55%, in 2023, and it will power at a considerable rate, as a result of the increase in the research and development activities by biotech and pharma companies for the expansion of new drugs and diagnostic solutions. 

For example, in Jan 2023, PharmaEssentia Corporation publicized plans for a new PIRC in Greater Boston, Massachusetts. Likewise, in October 2022, Lineage Cell Therapeutics Inc. publicized the opening of a novel research and development facility in California and the development of its GMP-compliant capability in Israel. Lineage’s novel facility in California will extend its R&D competences in the U.S. and support the expansion of present and future allogeneic cell transplant programs.

It is because of the growing prevalence of chronic and infectious diseases all over the world, the demand for multiplex assays is on the rise. This trend will also continue in the years to come as well.

Share:

Popular Posts

Blog Archive